Cambodian vs Cape Verdean Family Households with Children
COMPARE
Cambodian
Cape Verdean
Family Households with Children
Family Households with Children Comparison
Cambodians
Cape Verdeans
26.5%
FAMILY HOUSEHOLDS WITH CHILDREN
0.2/ 100
METRIC RATING
285th/ 347
METRIC RANK
26.9%
FAMILY HOUSEHOLDS WITH CHILDREN
3.6/ 100
METRIC RATING
236th/ 347
METRIC RANK
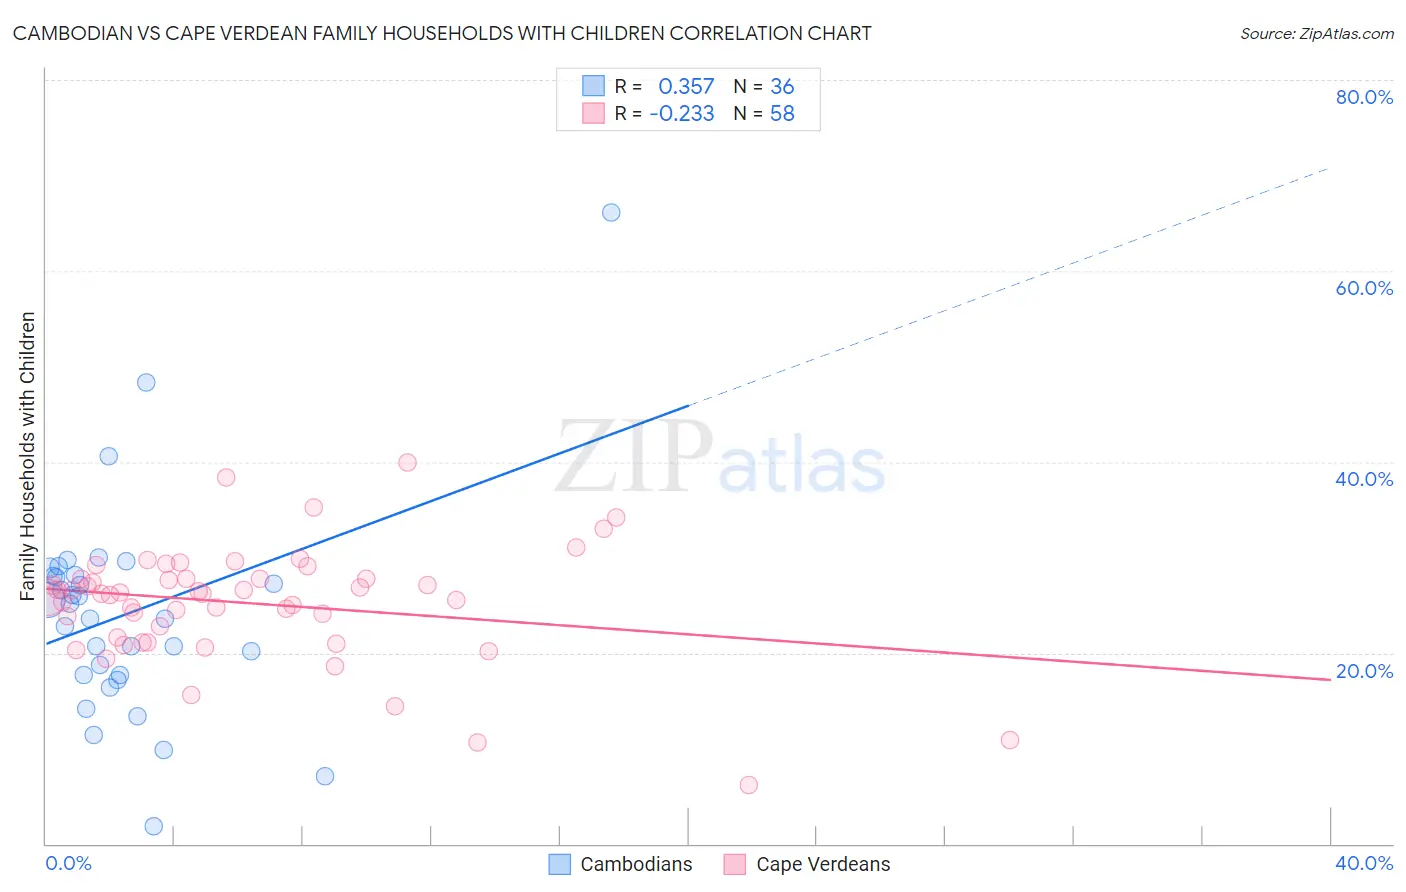
Cambodian vs Cape Verdean Family Households with Children Correlation Chart
The statistical analysis conducted on geographies consisting of 102,464,611 people shows a mild positive correlation between the proportion of Cambodians and percentage of family households with children in the United States with a correlation coefficient (R) of 0.357 and weighted average of 26.5%. Similarly, the statistical analysis conducted on geographies consisting of 107,535,448 people shows a weak negative correlation between the proportion of Cape Verdeans and percentage of family households with children in the United States with a correlation coefficient (R) of -0.233 and weighted average of 26.9%, a difference of 1.5%.
Family Households with Children Correlation Summary
| Measurement | Cambodian | Cape Verdean |
| Minimum | 1.8% | 6.1% |
| Maximum | 66.1% | 39.9% |
| Range | 64.3% | 33.7% |
| Mean | 24.1% | 25.2% |
| Median | 24.4% | 26.2% |
| Interquartile 25% (IQ1) | 17.6% | 21.6% |
| Interquartile 75% (IQ3) | 28.1% | 27.8% |
| Interquartile Range (IQR) | 10.4% | 6.1% |
| Standard Deviation (Sample) | 11.3% | 6.1% |
| Standard Deviation (Population) | 11.2% | 6.0% |
Similar Demographics by Family Households with Children
Demographics Similar to Cambodians by Family Households with Children
In terms of family households with children, the demographic groups most similar to Cambodians are Immigrants from Canada (26.5%, a difference of 0.030%), Immigrants from North America (26.6%, a difference of 0.050%), Immigrants from Senegal (26.5%, a difference of 0.050%), Shoshone (26.5%, a difference of 0.050%), and Russian (26.5%, a difference of 0.070%).
| Demographics | Rating | Rank | Family Households with Children |
| Immigrants | Europe | 0.4 /100 | #278 | Tragic 26.6% |
| Finns | 0.4 /100 | #279 | Tragic 26.6% |
| Senegalese | 0.4 /100 | #280 | Tragic 26.6% |
| Lithuanians | 0.3 /100 | #281 | Tragic 26.6% |
| French American Indians | 0.3 /100 | #282 | Tragic 26.6% |
| Immigrants | North America | 0.3 /100 | #283 | Tragic 26.6% |
| Immigrants | Canada | 0.3 /100 | #284 | Tragic 26.5% |
| Cambodians | 0.2 /100 | #285 | Tragic 26.5% |
| Immigrants | Senegal | 0.2 /100 | #286 | Tragic 26.5% |
| Shoshone | 0.2 /100 | #287 | Tragic 26.5% |
| Russians | 0.2 /100 | #288 | Tragic 26.5% |
| Immigrants | Sweden | 0.2 /100 | #289 | Tragic 26.5% |
| Albanians | 0.2 /100 | #290 | Tragic 26.5% |
| Bahamians | 0.2 /100 | #291 | Tragic 26.5% |
| Poles | 0.2 /100 | #292 | Tragic 26.5% |
Demographics Similar to Cape Verdeans by Family Households with Children
In terms of family households with children, the demographic groups most similar to Cape Verdeans are Immigrants from Netherlands (26.9%, a difference of 0.020%), Moroccan (26.9%, a difference of 0.020%), Immigrants from Southern Europe (26.9%, a difference of 0.030%), Immigrants from Bulgaria (26.9%, a difference of 0.050%), and Navajo (26.9%, a difference of 0.050%).
| Demographics | Rating | Rank | Family Households with Children |
| Immigrants | Caribbean | 6.3 /100 | #229 | Tragic 27.0% |
| Bulgarians | 5.8 /100 | #230 | Tragic 27.0% |
| Luxembourgers | 5.5 /100 | #231 | Tragic 27.0% |
| Yugoslavians | 5.1 /100 | #232 | Tragic 27.0% |
| Immigrants | Italy | 5.0 /100 | #233 | Tragic 27.0% |
| Immigrants | Germany | 4.4 /100 | #234 | Tragic 27.0% |
| Immigrants | Morocco | 4.2 /100 | #235 | Tragic 27.0% |
| Cape Verdeans | 3.6 /100 | #236 | Tragic 26.9% |
| Immigrants | Netherlands | 3.5 /100 | #237 | Tragic 26.9% |
| Moroccans | 3.4 /100 | #238 | Tragic 26.9% |
| Immigrants | Southern Europe | 3.4 /100 | #239 | Tragic 26.9% |
| Immigrants | Bulgaria | 3.3 /100 | #240 | Tragic 26.9% |
| Navajo | 3.2 /100 | #241 | Tragic 26.9% |
| Immigrants | England | 3.2 /100 | #242 | Tragic 26.9% |
| Immigrants | Saudi Arabia | 2.9 /100 | #243 | Tragic 26.9% |