Cajun vs Venezuelan Single Mother Poverty
COMPARE
Cajun
Venezuelan
Single Mother Poverty
Single Mother Poverty Comparison
Cajuns
Venezuelans
40.3%
SINGLE MOTHER POVERTY
0.0/ 100
METRIC RATING
343rd/ 347
METRIC RANK
28.2%
SINGLE MOTHER POVERTY
94.5/ 100
METRIC RATING
111th/ 347
METRIC RANK
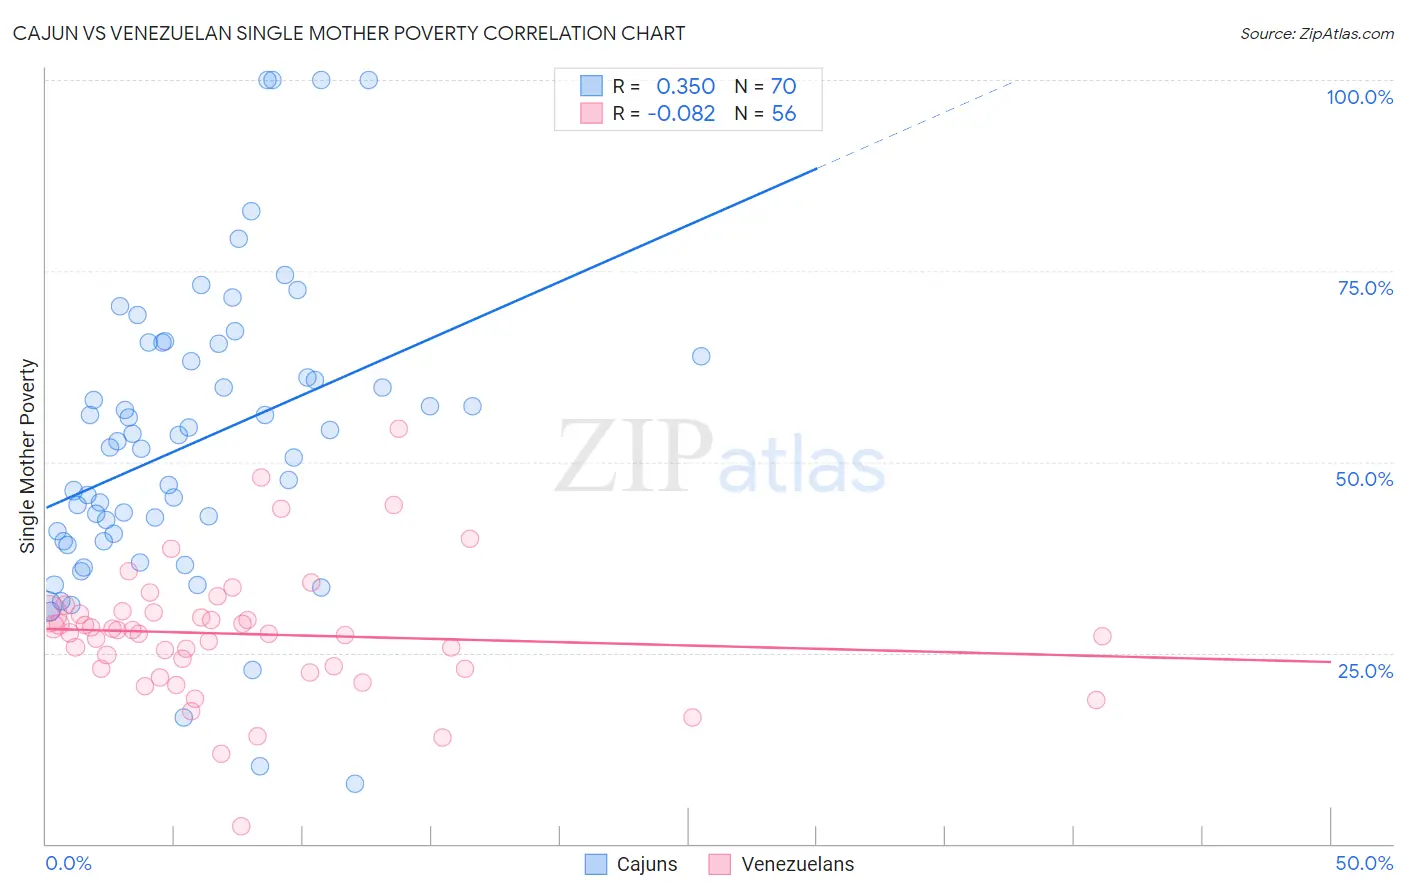
Cajun vs Venezuelan Single Mother Poverty Correlation Chart
The statistical analysis conducted on geographies consisting of 148,029,233 people shows a mild positive correlation between the proportion of Cajuns and poverty level among single mothers in the United States with a correlation coefficient (R) of 0.350 and weighted average of 40.3%. Similarly, the statistical analysis conducted on geographies consisting of 301,183,109 people shows a slight negative correlation between the proportion of Venezuelans and poverty level among single mothers in the United States with a correlation coefficient (R) of -0.082 and weighted average of 28.2%, a difference of 43.2%.
Single Mother Poverty Correlation Summary
| Measurement | Cajun | Venezuelan |
| Minimum | 7.8% | 2.4% |
| Maximum | 100.0% | 54.3% |
| Range | 92.2% | 51.9% |
| Mean | 52.5% | 27.4% |
| Median | 52.2% | 27.6% |
| Interquartile 25% (IQ1) | 39.6% | 22.9% |
| Interquartile 75% (IQ3) | 63.8% | 30.2% |
| Interquartile Range (IQR) | 24.2% | 7.3% |
| Standard Deviation (Sample) | 19.4% | 8.7% |
| Standard Deviation (Population) | 19.3% | 8.6% |
Similar Demographics by Single Mother Poverty
Demographics Similar to Cajuns by Single Mother Poverty
In terms of single mother poverty, the demographic groups most similar to Cajuns are Navajo (40.2%, a difference of 0.33%), Colville (39.3%, a difference of 2.7%), Sioux (38.8%, a difference of 4.0%), Crow (38.6%, a difference of 4.4%), and Pima (38.6%, a difference of 4.5%).
| Demographics | Rating | Rank | Single Mother Poverty |
| Menominee | 0.0 /100 | #333 | Tragic 37.1% |
| Pueblo | 0.0 /100 | #334 | Tragic 37.2% |
| Yuman | 0.0 /100 | #335 | Tragic 37.8% |
| Cheyenne | 0.0 /100 | #336 | Tragic 38.5% |
| Immigrants | Yemen | 0.0 /100 | #337 | Tragic 38.5% |
| Pima | 0.0 /100 | #338 | Tragic 38.6% |
| Crow | 0.0 /100 | #339 | Tragic 38.6% |
| Sioux | 0.0 /100 | #340 | Tragic 38.8% |
| Colville | 0.0 /100 | #341 | Tragic 39.3% |
| Navajo | 0.0 /100 | #342 | Tragic 40.2% |
| Cajuns | 0.0 /100 | #343 | Tragic 40.3% |
| Tohono O'odham | 0.0 /100 | #344 | Tragic 43.0% |
| Lumbee | 0.0 /100 | #345 | Tragic 43.2% |
| Houma | 0.0 /100 | #346 | Tragic 43.5% |
| Puerto Ricans | 0.0 /100 | #347 | Tragic 44.5% |
Demographics Similar to Venezuelans by Single Mother Poverty
In terms of single mother poverty, the demographic groups most similar to Venezuelans are Immigrants from Kazakhstan (28.2%, a difference of 0.010%), Croatian (28.2%, a difference of 0.050%), Immigrants from Armenia (28.1%, a difference of 0.17%), Immigrants from Zimbabwe (28.1%, a difference of 0.26%), and Immigrants from South Africa (28.3%, a difference of 0.29%).
| Demographics | Rating | Rank | Single Mother Poverty |
| Italians | 96.6 /100 | #104 | Exceptional 28.0% |
| Israelis | 96.5 /100 | #105 | Exceptional 28.0% |
| Ukrainians | 96.4 /100 | #106 | Exceptional 28.0% |
| Immigrants | Venezuela | 95.8 /100 | #107 | Exceptional 28.1% |
| Immigrants | Zimbabwe | 95.5 /100 | #108 | Exceptional 28.1% |
| Immigrants | Armenia | 95.2 /100 | #109 | Exceptional 28.1% |
| Croatians | 94.8 /100 | #110 | Exceptional 28.2% |
| Venezuelans | 94.5 /100 | #111 | Exceptional 28.2% |
| Immigrants | Kazakhstan | 94.5 /100 | #112 | Exceptional 28.2% |
| Immigrants | South Africa | 93.2 /100 | #113 | Exceptional 28.3% |
| Immigrants | Western Asia | 92.7 /100 | #114 | Exceptional 28.3% |
| Immigrants | Kuwait | 92.7 /100 | #115 | Exceptional 28.3% |
| Immigrants | Uganda | 92.5 /100 | #116 | Exceptional 28.3% |
| Australians | 92.5 /100 | #117 | Exceptional 28.3% |
| Brazilians | 92.4 /100 | #118 | Exceptional 28.3% |