Cajun vs Immigrants from Guatemala Single Mother Poverty
COMPARE
Cajun
Immigrants from Guatemala
Single Mother Poverty
Single Mother Poverty Comparison
Cajuns
Immigrants from Guatemala
40.3%
SINGLE MOTHER POVERTY
0.0/ 100
METRIC RATING
343rd/ 347
METRIC RANK
33.3%
SINGLE MOTHER POVERTY
0.0/ 100
METRIC RATING
299th/ 347
METRIC RANK
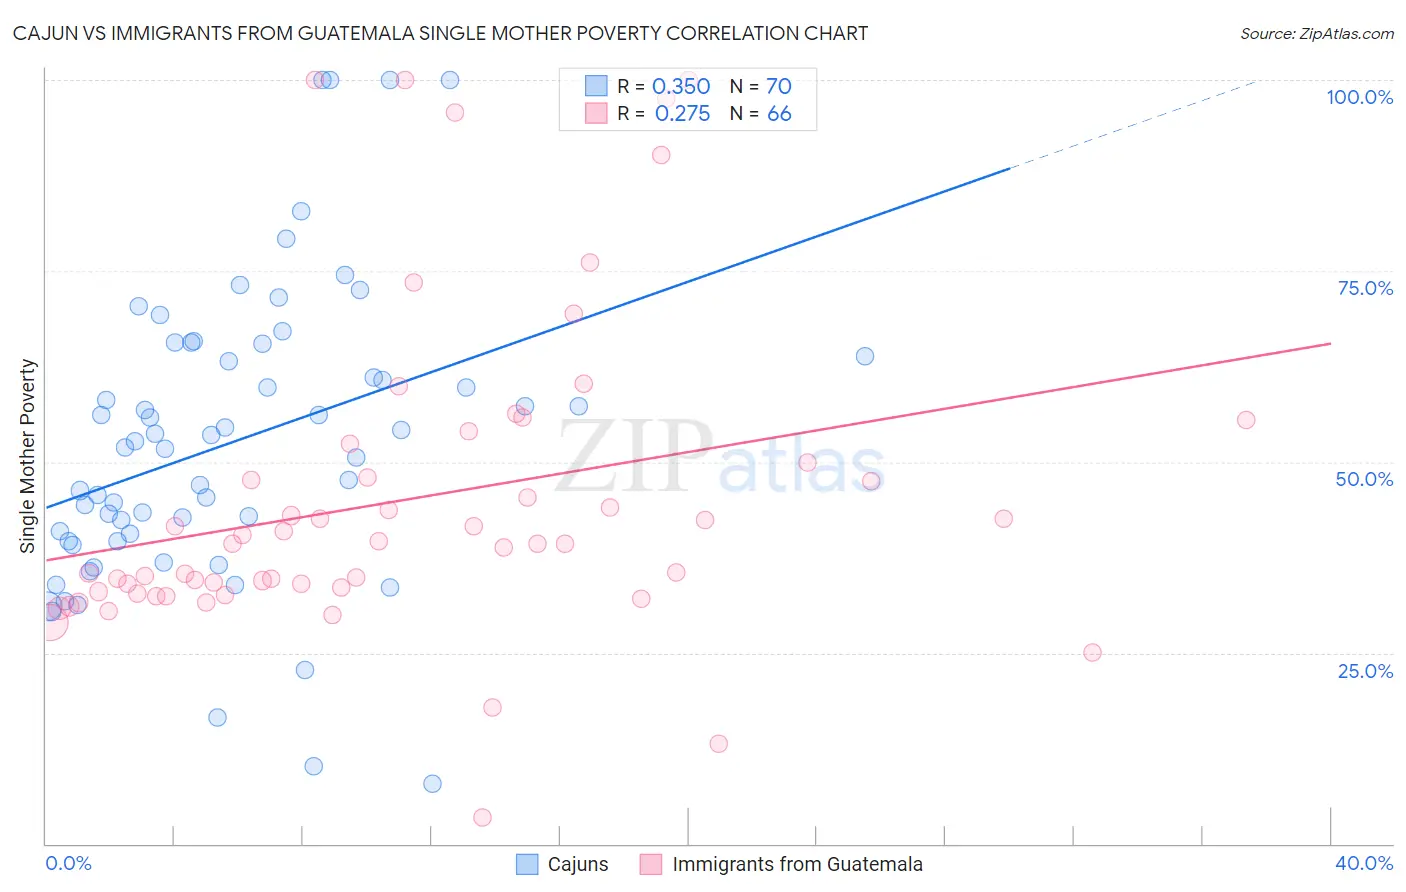
Cajun vs Immigrants from Guatemala Single Mother Poverty Correlation Chart
The statistical analysis conducted on geographies consisting of 148,029,233 people shows a mild positive correlation between the proportion of Cajuns and poverty level among single mothers in the United States with a correlation coefficient (R) of 0.350 and weighted average of 40.3%. Similarly, the statistical analysis conducted on geographies consisting of 371,171,029 people shows a weak positive correlation between the proportion of Immigrants from Guatemala and poverty level among single mothers in the United States with a correlation coefficient (R) of 0.275 and weighted average of 33.3%, a difference of 21.1%.
Single Mother Poverty Correlation Summary
| Measurement | Cajun | Immigrants from Guatemala |
| Minimum | 7.8% | 3.4% |
| Maximum | 100.0% | 100.0% |
| Range | 92.2% | 96.6% |
| Mean | 52.5% | 45.0% |
| Median | 52.2% | 39.3% |
| Interquartile 25% (IQ1) | 39.6% | 33.0% |
| Interquartile 75% (IQ3) | 63.8% | 50.0% |
| Interquartile Range (IQR) | 24.2% | 17.0% |
| Standard Deviation (Sample) | 19.4% | 20.7% |
| Standard Deviation (Population) | 19.3% | 20.5% |
Similar Demographics by Single Mother Poverty
Demographics Similar to Cajuns by Single Mother Poverty
In terms of single mother poverty, the demographic groups most similar to Cajuns are Navajo (40.2%, a difference of 0.33%), Colville (39.3%, a difference of 2.7%), Sioux (38.8%, a difference of 4.0%), Crow (38.6%, a difference of 4.4%), and Pima (38.6%, a difference of 4.5%).
| Demographics | Rating | Rank | Single Mother Poverty |
| Menominee | 0.0 /100 | #333 | Tragic 37.1% |
| Pueblo | 0.0 /100 | #334 | Tragic 37.2% |
| Yuman | 0.0 /100 | #335 | Tragic 37.8% |
| Cheyenne | 0.0 /100 | #336 | Tragic 38.5% |
| Immigrants | Yemen | 0.0 /100 | #337 | Tragic 38.5% |
| Pima | 0.0 /100 | #338 | Tragic 38.6% |
| Crow | 0.0 /100 | #339 | Tragic 38.6% |
| Sioux | 0.0 /100 | #340 | Tragic 38.8% |
| Colville | 0.0 /100 | #341 | Tragic 39.3% |
| Navajo | 0.0 /100 | #342 | Tragic 40.2% |
| Cajuns | 0.0 /100 | #343 | Tragic 40.3% |
| Tohono O'odham | 0.0 /100 | #344 | Tragic 43.0% |
| Lumbee | 0.0 /100 | #345 | Tragic 43.2% |
| Houma | 0.0 /100 | #346 | Tragic 43.5% |
| Puerto Ricans | 0.0 /100 | #347 | Tragic 44.5% |
Demographics Similar to Immigrants from Guatemala by Single Mother Poverty
In terms of single mother poverty, the demographic groups most similar to Immigrants from Guatemala are Hispanic or Latino (33.3%, a difference of 0.0%), African (33.3%, a difference of 0.090%), Pennsylvania German (33.2%, a difference of 0.20%), Immigrants from Somalia (33.4%, a difference of 0.25%), and Blackfeet (33.2%, a difference of 0.34%).
| Demographics | Rating | Rank | Single Mother Poverty |
| Shoshone | 0.0 /100 | #292 | Tragic 32.9% |
| Aleuts | 0.0 /100 | #293 | Tragic 32.9% |
| French American Indians | 0.0 /100 | #294 | Tragic 33.1% |
| Yaqui | 0.0 /100 | #295 | Tragic 33.1% |
| Blackfeet | 0.0 /100 | #296 | Tragic 33.2% |
| Pennsylvania Germans | 0.0 /100 | #297 | Tragic 33.2% |
| Africans | 0.0 /100 | #298 | Tragic 33.3% |
| Immigrants | Guatemala | 0.0 /100 | #299 | Tragic 33.3% |
| Hispanics or Latinos | 0.0 /100 | #300 | Tragic 33.3% |
| Immigrants | Somalia | 0.0 /100 | #301 | Tragic 33.4% |
| Arapaho | 0.0 /100 | #302 | Tragic 33.4% |
| Americans | 0.0 /100 | #303 | Tragic 33.5% |
| Mexicans | 0.0 /100 | #304 | Tragic 33.6% |
| Immigrants | Central America | 0.0 /100 | #305 | Tragic 33.6% |
| Immigrants | Congo | 0.0 /100 | #306 | Tragic 33.8% |