Italian vs Immigrants from Micronesia Single Mother Poverty
COMPARE
Italian
Immigrants from Micronesia
Single Mother Poverty
Single Mother Poverty Comparison
Italians
Immigrants from Micronesia
28.0%
SINGLE MOTHER POVERTY
96.6/ 100
METRIC RATING
104th/ 347
METRIC RANK
31.6%
SINGLE MOTHER POVERTY
0.1/ 100
METRIC RATING
272nd/ 347
METRIC RANK
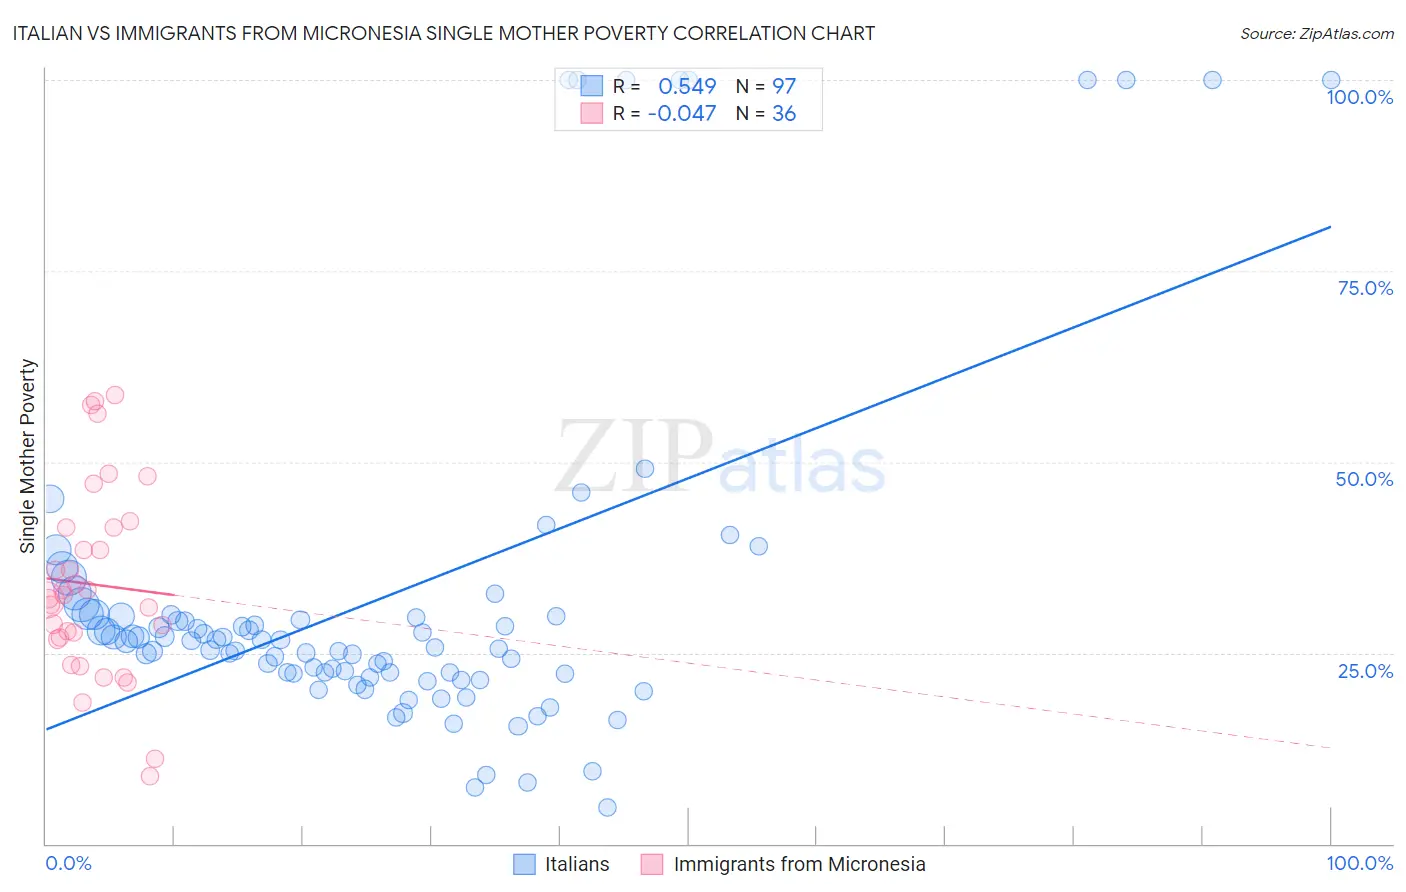
Italian vs Immigrants from Micronesia Single Mother Poverty Correlation Chart
The statistical analysis conducted on geographies consisting of 546,043,185 people shows a substantial positive correlation between the proportion of Italians and poverty level among single mothers in the United States with a correlation coefficient (R) of 0.549 and weighted average of 28.0%. Similarly, the statistical analysis conducted on geographies consisting of 61,413,620 people shows no correlation between the proportion of Immigrants from Micronesia and poverty level among single mothers in the United States with a correlation coefficient (R) of -0.047 and weighted average of 31.6%, a difference of 12.8%.
Single Mother Poverty Correlation Summary
| Measurement | Italian | Immigrants from Micronesia |
| Minimum | 4.7% | 8.8% |
| Maximum | 100.0% | 58.8% |
| Range | 95.3% | 50.0% |
| Mean | 32.3% | 34.0% |
| Median | 26.6% | 32.3% |
| Interquartile 25% (IQ1) | 22.3% | 26.9% |
| Interquartile 75% (IQ3) | 29.9% | 41.3% |
| Interquartile Range (IQR) | 7.6% | 14.5% |
| Standard Deviation (Sample) | 23.0% | 12.4% |
| Standard Deviation (Population) | 22.9% | 12.2% |
Similar Demographics by Single Mother Poverty
Demographics Similar to Italians by Single Mother Poverty
In terms of single mother poverty, the demographic groups most similar to Italians are Immigrants from Northern Africa (28.0%, a difference of 0.020%), Israeli (28.0%, a difference of 0.020%), Immigrants from Croatia (28.0%, a difference of 0.030%), Ukrainian (28.0%, a difference of 0.070%), and Pakistani (28.0%, a difference of 0.14%).
| Demographics | Rating | Rank | Single Mother Poverty |
| Immigrants | Brazil | 97.2 /100 | #97 | Exceptional 27.9% |
| Immigrants | Nepal | 97.2 /100 | #98 | Exceptional 27.9% |
| Immigrants | Netherlands | 97.2 /100 | #99 | Exceptional 27.9% |
| Zimbabweans | 97.1 /100 | #100 | Exceptional 27.9% |
| Pakistanis | 96.9 /100 | #101 | Exceptional 28.0% |
| Immigrants | Croatia | 96.7 /100 | #102 | Exceptional 28.0% |
| Immigrants | Northern Africa | 96.6 /100 | #103 | Exceptional 28.0% |
| Italians | 96.6 /100 | #104 | Exceptional 28.0% |
| Israelis | 96.5 /100 | #105 | Exceptional 28.0% |
| Ukrainians | 96.4 /100 | #106 | Exceptional 28.0% |
| Immigrants | Venezuela | 95.8 /100 | #107 | Exceptional 28.1% |
| Immigrants | Zimbabwe | 95.5 /100 | #108 | Exceptional 28.1% |
| Immigrants | Armenia | 95.2 /100 | #109 | Exceptional 28.1% |
| Croatians | 94.8 /100 | #110 | Exceptional 28.2% |
| Venezuelans | 94.5 /100 | #111 | Exceptional 28.2% |
Demographics Similar to Immigrants from Micronesia by Single Mother Poverty
In terms of single mother poverty, the demographic groups most similar to Immigrants from Micronesia are Immigrants from Cabo Verde (31.6%, a difference of 0.010%), Fijian (31.6%, a difference of 0.23%), British West Indian (31.5%, a difference of 0.26%), Scotch-Irish (31.5%, a difference of 0.30%), and Immigrants from Senegal (31.5%, a difference of 0.35%).
| Demographics | Rating | Rank | Single Mother Poverty |
| German Russians | 0.2 /100 | #265 | Tragic 31.3% |
| Sub-Saharan Africans | 0.2 /100 | #266 | Tragic 31.4% |
| Immigrants | Belize | 0.2 /100 | #267 | Tragic 31.4% |
| Immigrants | Senegal | 0.1 /100 | #268 | Tragic 31.5% |
| Scotch-Irish | 0.1 /100 | #269 | Tragic 31.5% |
| British West Indians | 0.1 /100 | #270 | Tragic 31.5% |
| Immigrants | Cabo Verde | 0.1 /100 | #271 | Tragic 31.6% |
| Immigrants | Micronesia | 0.1 /100 | #272 | Tragic 31.6% |
| Fijians | 0.1 /100 | #273 | Tragic 31.6% |
| Bangladeshis | 0.1 /100 | #274 | Tragic 31.7% |
| Central Americans | 0.1 /100 | #275 | Tragic 31.8% |
| Delaware | 0.0 /100 | #276 | Tragic 31.8% |
| Mexican American Indians | 0.0 /100 | #277 | Tragic 31.9% |
| Immigrants | Zaire | 0.0 /100 | #278 | Tragic 32.0% |
| Marshallese | 0.0 /100 | #279 | Tragic 32.1% |