Burmese vs Immigrants from Eritrea 10th Grade
COMPARE
Burmese
Immigrants from Eritrea
10th Grade
10th Grade Comparison
Burmese
Immigrants from Eritrea
94.5%
10TH GRADE
97.1/ 100
METRIC RATING
110th/ 347
METRIC RANK
92.5%
10TH GRADE
0.3/ 100
METRIC RATING
271st/ 347
METRIC RANK
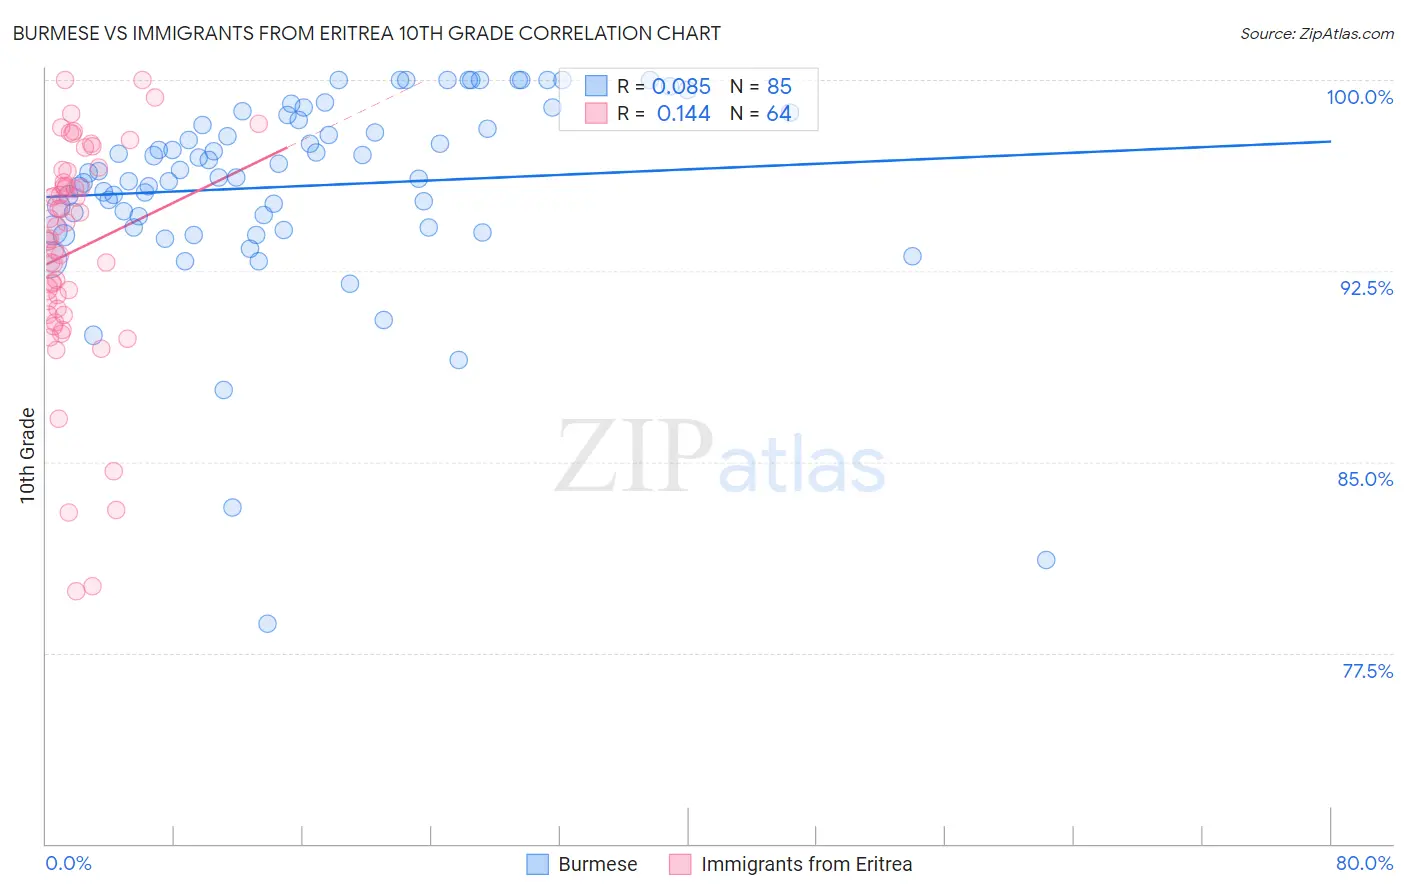
Burmese vs Immigrants from Eritrea 10th Grade Correlation Chart
The statistical analysis conducted on geographies consisting of 465,370,495 people shows a slight positive correlation between the proportion of Burmese and percentage of population with at least 10th grade education in the United States with a correlation coefficient (R) of 0.085 and weighted average of 94.5%. Similarly, the statistical analysis conducted on geographies consisting of 104,754,230 people shows a poor positive correlation between the proportion of Immigrants from Eritrea and percentage of population with at least 10th grade education in the United States with a correlation coefficient (R) of 0.144 and weighted average of 92.5%, a difference of 2.1%.
10th Grade Correlation Summary
| Measurement | Burmese | Immigrants from Eritrea |
| Minimum | 78.7% | 79.9% |
| Maximum | 100.0% | 100.0% |
| Range | 21.3% | 20.1% |
| Mean | 95.8% | 93.3% |
| Median | 96.4% | 94.0% |
| Interquartile 25% (IQ1) | 94.2% | 90.9% |
| Interquartile 75% (IQ3) | 98.5% | 96.2% |
| Interquartile Range (IQR) | 4.3% | 5.3% |
| Standard Deviation (Sample) | 3.9% | 4.4% |
| Standard Deviation (Population) | 3.9% | 4.4% |
Similar Demographics by 10th Grade
Demographics Similar to Burmese by 10th Grade
In terms of 10th grade, the demographic groups most similar to Burmese are Immigrants from North Macedonia (94.5%, a difference of 0.010%), Immigrants from Norway (94.5%, a difference of 0.010%), Immigrants from Serbia (94.5%, a difference of 0.020%), Immigrants from Croatia (94.5%, a difference of 0.020%), and Immigrants from Zimbabwe (94.4%, a difference of 0.020%).
| Demographics | Rating | Rank | 10th Grade |
| Immigrants | Europe | 97.5 /100 | #103 | Exceptional 94.5% |
| Immigrants | Romania | 97.5 /100 | #104 | Exceptional 94.5% |
| Immigrants | Turkey | 97.4 /100 | #105 | Exceptional 94.5% |
| Immigrants | Serbia | 97.4 /100 | #106 | Exceptional 94.5% |
| Immigrants | Croatia | 97.4 /100 | #107 | Exceptional 94.5% |
| Immigrants | North Macedonia | 97.2 /100 | #108 | Exceptional 94.5% |
| Immigrants | Norway | 97.2 /100 | #109 | Exceptional 94.5% |
| Burmese | 97.1 /100 | #110 | Exceptional 94.5% |
| Immigrants | Zimbabwe | 96.8 /100 | #111 | Exceptional 94.4% |
| Immigrants | Kuwait | 96.8 /100 | #112 | Exceptional 94.4% |
| Palestinians | 96.5 /100 | #113 | Exceptional 94.4% |
| German Russians | 96.3 /100 | #114 | Exceptional 94.4% |
| Delaware | 96.3 /100 | #115 | Exceptional 94.4% |
| Sioux | 96.2 /100 | #116 | Exceptional 94.4% |
| Immigrants | Hungary | 95.8 /100 | #117 | Exceptional 94.4% |
Demographics Similar to Immigrants from Eritrea by 10th Grade
In terms of 10th grade, the demographic groups most similar to Immigrants from Eritrea are Immigrants from Uruguay (92.5%, a difference of 0.010%), Immigrants from Western Africa (92.5%, a difference of 0.010%), Immigrants from Colombia (92.5%, a difference of 0.020%), Taiwanese (92.5%, a difference of 0.030%), and Immigrants from Ghana (92.5%, a difference of 0.030%).
| Demographics | Rating | Rank | 10th Grade |
| Peruvians | 0.4 /100 | #264 | Tragic 92.6% |
| Dutch West Indians | 0.4 /100 | #265 | Tragic 92.6% |
| Immigrants | Philippines | 0.4 /100 | #266 | Tragic 92.6% |
| Taiwanese | 0.3 /100 | #267 | Tragic 92.5% |
| Immigrants | Ghana | 0.3 /100 | #268 | Tragic 92.5% |
| Immigrants | Colombia | 0.3 /100 | #269 | Tragic 92.5% |
| Immigrants | Uruguay | 0.3 /100 | #270 | Tragic 92.5% |
| Immigrants | Eritrea | 0.3 /100 | #271 | Tragic 92.5% |
| Immigrants | Western Africa | 0.3 /100 | #272 | Tragic 92.5% |
| Trinidadians and Tobagonians | 0.2 /100 | #273 | Tragic 92.4% |
| Immigrants | Congo | 0.2 /100 | #274 | Tragic 92.4% |
| West Indians | 0.2 /100 | #275 | Tragic 92.4% |
| Immigrants | Trinidad and Tobago | 0.1 /100 | #276 | Tragic 92.3% |
| Navajo | 0.1 /100 | #277 | Tragic 92.3% |
| Barbadians | 0.1 /100 | #278 | Tragic 92.2% |