Bulgarian vs Ethiopian Single Female Poverty
COMPARE
Bulgarian
Ethiopian
Single Female Poverty
Single Female Poverty Comparison
Bulgarians
Ethiopians
18.8%
SINGLE FEMALE POVERTY
99.9/ 100
METRIC RATING
39th/ 347
METRIC RANK
19.9%
SINGLE FEMALE POVERTY
96.7/ 100
METRIC RATING
106th/ 347
METRIC RANK
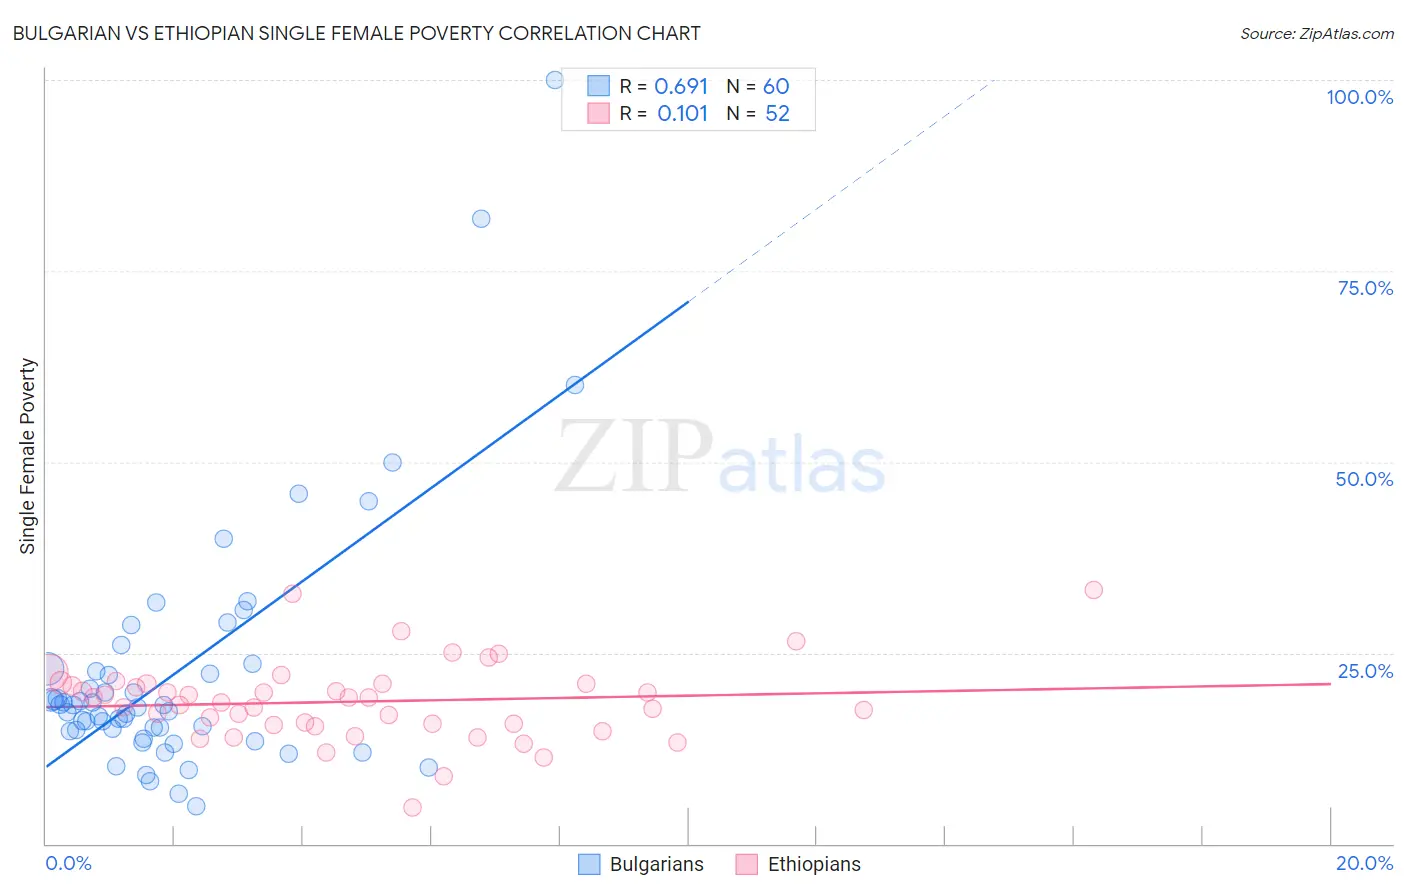
Bulgarian vs Ethiopian Single Female Poverty Correlation Chart
The statistical analysis conducted on geographies consisting of 203,529,625 people shows a significant positive correlation between the proportion of Bulgarians and poverty level among single females in the United States with a correlation coefficient (R) of 0.691 and weighted average of 18.8%. Similarly, the statistical analysis conducted on geographies consisting of 221,686,273 people shows a poor positive correlation between the proportion of Ethiopians and poverty level among single females in the United States with a correlation coefficient (R) of 0.101 and weighted average of 19.9%, a difference of 5.9%.
Single Female Poverty Correlation Summary
| Measurement | Bulgarian | Ethiopian |
| Minimum | 5.0% | 4.8% |
| Maximum | 100.0% | 33.2% |
| Range | 95.0% | 28.4% |
| Mean | 22.4% | 18.6% |
| Median | 18.0% | 18.8% |
| Interquartile 25% (IQ1) | 14.8% | 15.6% |
| Interquartile 75% (IQ3) | 22.7% | 20.9% |
| Interquartile Range (IQR) | 7.9% | 5.3% |
| Standard Deviation (Sample) | 16.6% | 5.2% |
| Standard Deviation (Population) | 16.5% | 5.1% |
Similar Demographics by Single Female Poverty
Demographics Similar to Bulgarians by Single Female Poverty
In terms of single female poverty, the demographic groups most similar to Bulgarians are Tongan (18.8%, a difference of 0.030%), Okinawan (18.8%, a difference of 0.030%), Immigrants from Serbia (18.8%, a difference of 0.050%), Jordanian (18.8%, a difference of 0.13%), and Immigrants from Romania (18.8%, a difference of 0.28%).
| Demographics | Rating | Rank | Single Female Poverty |
| Immigrants | Sri Lanka | 99.9 /100 | #32 | Exceptional 18.6% |
| Immigrants | Philippines | 99.9 /100 | #33 | Exceptional 18.6% |
| Koreans | 99.9 /100 | #34 | Exceptional 18.6% |
| Immigrants | Japan | 99.9 /100 | #35 | Exceptional 18.6% |
| Turks | 99.9 /100 | #36 | Exceptional 18.7% |
| Immigrants | Armenia | 99.9 /100 | #37 | Exceptional 18.7% |
| Tongans | 99.9 /100 | #38 | Exceptional 18.8% |
| Bulgarians | 99.9 /100 | #39 | Exceptional 18.8% |
| Okinawans | 99.9 /100 | #40 | Exceptional 18.8% |
| Immigrants | Serbia | 99.9 /100 | #41 | Exceptional 18.8% |
| Jordanians | 99.9 /100 | #42 | Exceptional 18.8% |
| Immigrants | Romania | 99.9 /100 | #43 | Exceptional 18.8% |
| Immigrants | Croatia | 99.9 /100 | #44 | Exceptional 18.9% |
| Immigrants | Indonesia | 99.8 /100 | #45 | Exceptional 18.9% |
| Macedonians | 99.8 /100 | #46 | Exceptional 18.9% |
Demographics Similar to Ethiopians by Single Female Poverty
In terms of single female poverty, the demographic groups most similar to Ethiopians are Immigrants from Syria (19.9%, a difference of 0.020%), Native Hawaiian (19.9%, a difference of 0.070%), Colombian (19.9%, a difference of 0.070%), Immigrants from Western Asia (19.9%, a difference of 0.080%), and Israeli (19.9%, a difference of 0.090%).
| Demographics | Rating | Rank | Single Female Poverty |
| Sierra Leoneans | 97.9 /100 | #99 | Exceptional 19.7% |
| Ukrainians | 97.6 /100 | #100 | Exceptional 19.8% |
| Immigrants | Belgium | 97.3 /100 | #101 | Exceptional 19.8% |
| Immigrants | Cameroon | 97.3 /100 | #102 | Exceptional 19.8% |
| Immigrants | Southern Europe | 97.1 /100 | #103 | Exceptional 19.9% |
| Chileans | 96.9 /100 | #104 | Exceptional 19.9% |
| Israelis | 96.9 /100 | #105 | Exceptional 19.9% |
| Ethiopians | 96.7 /100 | #106 | Exceptional 19.9% |
| Immigrants | Syria | 96.7 /100 | #107 | Exceptional 19.9% |
| Native Hawaiians | 96.6 /100 | #108 | Exceptional 19.9% |
| Colombians | 96.6 /100 | #109 | Exceptional 19.9% |
| Immigrants | Western Asia | 96.5 /100 | #110 | Exceptional 19.9% |
| Carpatho Rusyns | 96.1 /100 | #111 | Exceptional 20.0% |
| Immigrants | Netherlands | 96.0 /100 | #112 | Exceptional 20.0% |
| Immigrants | Zimbabwe | 95.9 /100 | #113 | Exceptional 20.0% |