Scotch-Irish vs Seminole Child Poverty Under the Age of 5

COMPARE

Scotch-Irish
Race
Ancestry
AfghanAfricanAlaska NativeAlaskan AthabascanAlbanianAleutAlsatianAmericanApacheArabArapahoArgentineanArmenianAssyrian/Chaldean/SyriacAustralianAustrianBahamianBangladeshiBarbadianBasqueBelgianBelizeanBermudanBhutaneseBlackfeetBolivianBrazilianBritishBritish West IndianBulgarianBurmeseCajunCambodianCanadianCape VerdeanCarpatho RusynCelticCentral AmericanCentral American IndianCherokeeCheyenneChickasawChileanChineseChippewaChoctawColombianColvilleComancheCosta RicanCreeCreekCroatianCrowCubanCypriotCzechCzechoslovakianDanishDelawareDominicanDutchDutch West IndianEastern EuropeanEcuadorianEgyptianEnglishEstonianEthiopianEuropeanFijianFilipinoFinnishFrenchFrench American IndianFrench CanadianGermanGerman RussianGhanaianGreekGuamanian/ChamorroGuatemalanGuyaneseHaitianHmongHonduranHopiHoumaHungarianIcelanderIndian (Asian)IndonesianInupiatIranianIraqiIrishIroquoisIsraeliItalianJamaicanJapaneseJordanianKenyanKiowaKoreanLaotianLatvianLebaneseLiberianLithuanianLumbeeLuxembourgerMacedonianMalaysianMalteseMarshalleseMenomineeMexicanMexican American IndianMongolianMoroccanNative HawaiianNavajoNepaleseNew ZealanderNicaraguanNigerianNorthern EuropeanNorwegianOkinawanOsageOttawaPaiutePakistaniPalestinianPanamanianParaguayanPennsylvania GermanPeruvianPimaPolishPortuguesePotawatomiPuebloPuerto RicanPuget Sound SalishRomanianRussianSalvadoranSamoanScandinavianScotch-IrishScottishSenegaleseSerbianShoshoneSierra LeoneanSiouxSlavicSlovakSloveneSomaliSouth AfricanSouth AmericanSouth American IndianSoviet UnionSpaniardSpanishSpanish AmericanSpanish American IndianSri LankanSubsaharan AfricanSudaneseSwedishSwissSyrianTaiwaneseThaiTlingit-HaidaTohono O'OdhamTonganTrinidadian and TobagonianTsimshianTurkishU.S. Virgin IslanderUgandanUkrainianUruguayanUteVenezuelanVietnameseWelshWest IndianYakamaYaquiYugoslavianYumanYup'ikZimbabwean
Immigration
NonimmigrantsImmigrantsAfghanistanAfricaAlbaniaArgentinaArmeniaAsiaAustraliaAustriaBahamasBangladeshBarbadosBelarusBelgiumBelizeBoliviaBosnia and HerzegovinaBrazilBulgariaBurma/MyanmarCabo VerdeCambodiaCameroonCanadaCaribbeanCentral AmericaChileChinaColombiaCongoCosta RicaCroatiaCubaCzechoslovakiaDenmarkDominicaDominican RepublicEastern AfricaEastern AsiaEastern EuropeEcuadorEgyptEl SalvadorEnglandEritreaEthiopiaEuropeFijiFranceGermanyGhanaGreeceGrenadaGuatemalaGuyanaHaitiHondurasHong KongHungaryIndiaIndonesiaIranIraqIrelandIsraelItalyJamaicaJapanJordanKazakhstanKenyaKoreaKuwaitLaosLatin AmericaLatviaLebanonLiberiaLithuaniaMalaysiaMexicoMicronesiaMiddle AfricaMoldovaMoroccoNepalNetherlandsNicaraguaNigeriaNorth AmericaNorth MacedoniaNorthern AfricaNorthern EuropeNorwayOceaniaPakistanPanamaPeruPhilippinesPolandPortugalRomaniaRussiaSaudi ArabiaScotlandSenegalSerbiaSierra LeoneSingaporeSomaliaSouth AfricaSouth AmericaSouth Central AsiaSouth Eastern AsiaSouthern EuropeSpainSri LankaSt. Vincent and the GrenadinesSudanSwedenSwitzerlandSyriaTaiwanThailandTrinidad and TobagoTurkeyUgandaUkraineUruguayUzbekistanVenezuelaVietnamWest IndiesWestern AfricaWestern AsiaWestern EuropeYemenZaireZimbabweAzores
Seminole
Race
Ancestry
AfghanAfricanAlaska NativeAlaskan AthabascanAlbanianAleutAlsatianAmericanApacheArabArapahoArgentineanArmenianAssyrian/Chaldean/SyriacAustralianAustrianBahamianBangladeshiBarbadianBasqueBelgianBelizeanBermudanBhutaneseBlackfeetBolivianBrazilianBritishBritish West IndianBulgarianBurmeseCajunCambodianCanadianCape VerdeanCarpatho RusynCelticCentral AmericanCentral American IndianCherokeeCheyenneChickasawChileanChineseChippewaChoctawColombianColvilleComancheCosta RicanCreeCreekCroatianCrowCubanCypriotCzechCzechoslovakianDanishDelawareDominicanDutchDutch West IndianEastern EuropeanEcuadorianEgyptianEnglishEstonianEthiopianEuropeanFijianFilipinoFinnishFrenchFrench American IndianFrench CanadianGermanGerman RussianGhanaianGreekGuamanian/ChamorroGuatemalanGuyaneseHaitianHmongHonduranHopiHoumaHungarianIcelanderIndian (Asian)IndonesianInupiatIranianIraqiIrishIroquoisIsraeliItalianJamaicanJapaneseJordanianKenyanKiowaKoreanLaotianLatvianLebaneseLiberianLithuanianLumbeeLuxembourgerMacedonianMalaysianMalteseMarshalleseMenomineeMexicanMexican American IndianMongolianMoroccanNative HawaiianNavajoNepaleseNew ZealanderNicaraguanNigerianNorthern EuropeanNorwegianOkinawanOsageOttawaPaiutePakistaniPalestinianPanamanianParaguayanPennsylvania GermanPeruvianPimaPolishPortuguesePotawatomiPuebloPuerto RicanPuget Sound SalishRomanianRussianSalvadoranSamoanScandinavianScottishSeminoleSenegaleseSerbianShoshoneSierra LeoneanSiouxSlavicSlovakSloveneSomaliSouth AfricanSouth AmericanSouth American IndianSoviet UnionSpaniardSpanishSpanish AmericanSpanish American IndianSri LankanSubsaharan AfricanSudaneseSwedishSwissSyrianTaiwaneseThaiTlingit-HaidaTohono O'OdhamTonganTrinidadian and TobagonianTsimshianTurkishU.S. Virgin IslanderUgandanUkrainianUruguayanUteVenezuelanVietnameseWelshWest IndianYakamaYaquiYugoslavianYumanYup'ikZimbabwean
Immigration
NonimmigrantsImmigrantsAfghanistanAfricaAlbaniaArgentinaArmeniaAsiaAustraliaAustriaBahamasBangladeshBarbadosBelarusBelgiumBelizeBoliviaBosnia and HerzegovinaBrazilBulgariaBurma/MyanmarCabo VerdeCambodiaCameroonCanadaCaribbeanCentral AmericaChileChinaColombiaCongoCosta RicaCroatiaCubaCzechoslovakiaDenmarkDominicaDominican RepublicEastern AfricaEastern AsiaEastern EuropeEcuadorEgyptEl SalvadorEnglandEritreaEthiopiaEuropeFijiFranceGermanyGhanaGreeceGrenadaGuatemalaGuyanaHaitiHondurasHong KongHungaryIndiaIndonesiaIranIraqIrelandIsraelItalyJamaicaJapanJordanKazakhstanKenyaKoreaKuwaitLaosLatin AmericaLatviaLebanonLiberiaLithuaniaMalaysiaMexicoMicronesiaMiddle AfricaMoldovaMoroccoNepalNetherlandsNicaraguaNigeriaNorth AmericaNorth MacedoniaNorthern AfricaNorthern EuropeNorwayOceaniaPakistanPanamaPeruPhilippinesPolandPortugalRomaniaRussiaSaudi ArabiaScotlandSenegalSerbiaSierra LeoneSingaporeSomaliaSouth AfricaSouth AmericaSouth Central AsiaSouth Eastern AsiaSouthern EuropeSpainSri LankaSt. Vincent and the GrenadinesSudanSwedenSwitzerlandSyriaTaiwanThailandTrinidad and TobagoTurkeyUgandaUkraineUruguayUzbekistanVenezuelaVietnamWest IndiesWestern AfricaWestern AsiaWestern EuropeYemenZaireZimbabweAzores
Child Poverty Under the Age of 5
Income
Poverty
Unemployment
Labor Participation
Family Structure
Vehicle Availability
Education Level
Disability

Child Poverty Under the Age of 5 Comparison

Scotch-Irish

Seminole

Tragic
Tragic
18.2%
CHILD POVERTY UNDER THE AGE OF 5
9.8/ 100
METRIC RATING
208th/ 347
METRIC RANK
22.8%
CHILD POVERTY UNDER THE AGE OF 5
0.0/ 100
METRIC RATING
311th/ 347
METRIC RANK

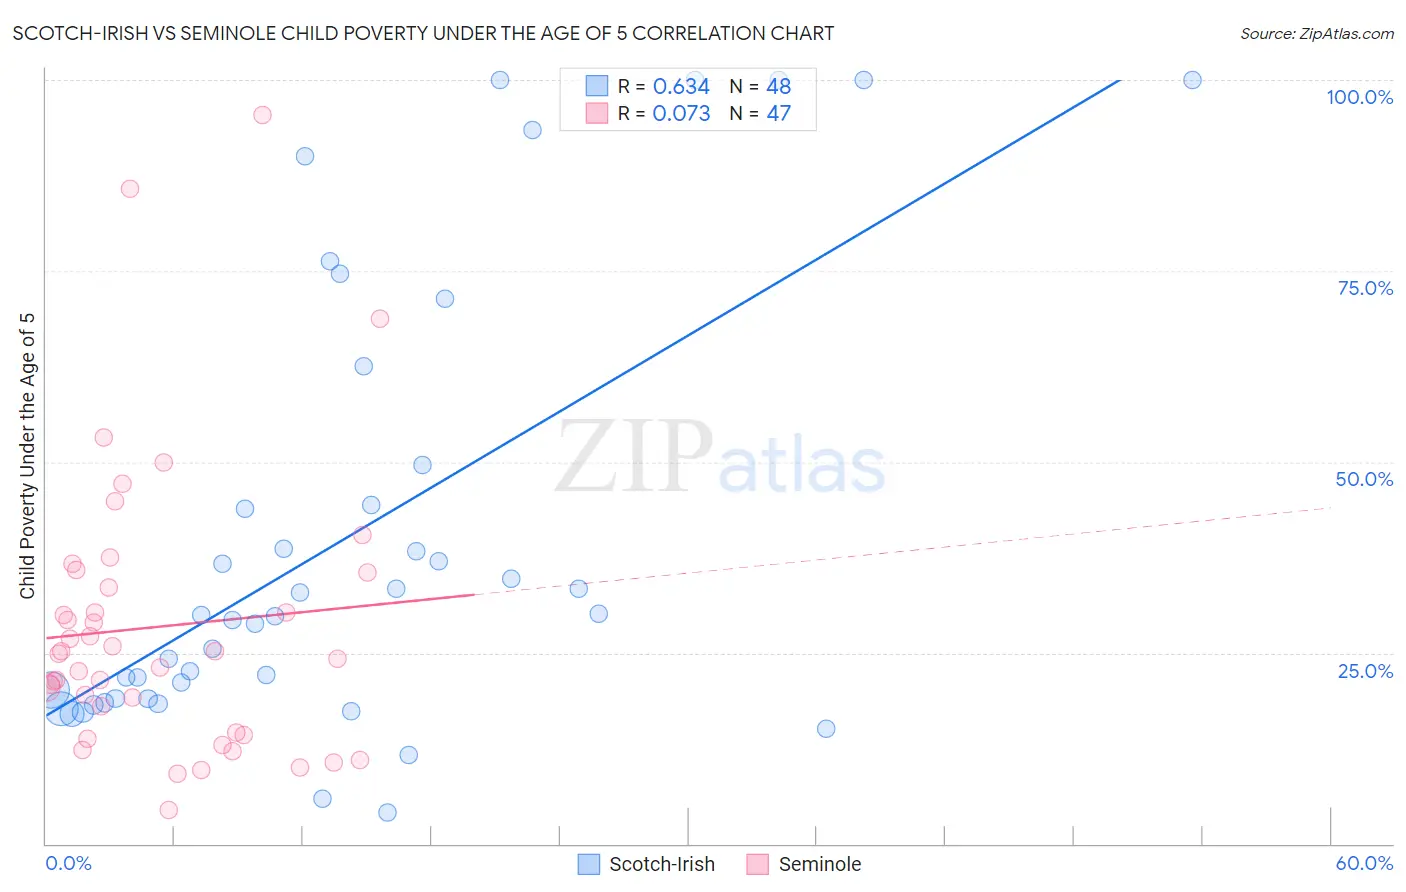
Scotch-Irish vs Seminole Child Poverty Under the Age of 5 Correlation Chart

The statistical analysis conducted on geographies consisting of 512,287,895 people shows a significant positive correlation between the proportion of Scotch-Irish and poverty level among children under the age of 5 in the United States with a correlation coefficient (R) of 0.634 and weighted average of 18.2%. Similarly, the statistical analysis conducted on geographies consisting of 117,328,756 people shows a slight positive correlation between the proportion of Seminole and poverty level among children under the age of 5 in the United States with a correlation coefficient (R) of 0.073 and weighted average of 22.8%, a difference of 25.3%.
Scotch-Irish vs Seminole Child Poverty Under the Age of 5

Child Poverty Under the Age of 5 Correlation Summary

MeasurementScotch-IrishSeminole
Minimum4.1%4.3%
Maximum100.0%95.5%
Range95.9%91.1%
Mean39.9%28.4%
Median29.9%24.9%
Interquartile 25% (IQ1)19.0%14.6%
Interquartile 75% (IQ3)47.0%35.5%
Interquartile Range (IQR)28.1%20.9%
Standard Deviation (Sample)28.8%18.6%
Standard Deviation (Population)28.5%18.4%

Similar Demographics by Child Poverty Under the Age of 5

Demographics Similar to Scotch-Irish by Child Poverty Under the Age of 5

In terms of child poverty under the age of 5, the demographic groups most similar to Scotch-Irish are Spanish (18.2%, a difference of 0.010%), Immigrants (18.2%, a difference of 0.020%), Panamanian (18.2%, a difference of 0.020%), Moroccan (18.2%, a difference of 0.11%), and Nepalese (18.3%, a difference of 0.32%).
DemographicsRating | RankChild Poverty Under the Age of 5
Ugandans
13.9
/100
|
#201
Poor
18.0%
Japanese
13.8
/100
|
#202
Poor
18.1%
Immigrants | Cambodia
13.7
/100
|
#203
Poor
18.1%
Immigrants | Eastern Africa
13.4
/100
|
#204
Poor
18.1%
Spaniards
12.8
/100
|
#205
Poor
18.1%
Whites/Caucasians
12.6
/100
|
#206
Poor
18.1%
Immigrants | Immigrants
9.9
/100
|
#207
Tragic
18.2%
Scotch-Irish
9.8
/100
|
#208
Tragic
18.2%
Spanish
9.8
/100
|
#209
Tragic
18.2%
Panamanians
9.7
/100
|
#210
Tragic
18.2%
Moroccans
9.4
/100
|
#211
Tragic
18.2%
Nepalese
8.7
/100
|
#212
Tragic
18.3%
Immigrants | Thailand
8.6
/100
|
#213
Tragic
18.3%
Malaysians
6.5
/100
|
#214
Tragic
18.4%
Immigrants | Panama
6.0
/100
|
#215
Tragic
18.5%

Demographics Similar to Seminole by Child Poverty Under the Age of 5

In terms of child poverty under the age of 5, the demographic groups most similar to Seminole are African (22.8%, a difference of 0.050%), Houma (22.7%, a difference of 0.45%), Immigrants from Dominica (22.7%, a difference of 0.59%), Honduran (23.0%, a difference of 0.60%), and Immigrants from Bahamas (22.7%, a difference of 0.63%).
DemographicsRating | RankChild Poverty Under the Age of 5
Immigrants | Guatemala
0.0
/100
|
#304
Tragic
22.0%
Immigrants | Mexico
0.0
/100
|
#305
Tragic
22.2%
Indonesians
0.0
/100
|
#306
Tragic
22.3%
Immigrants | Bahamas
0.0
/100
|
#307
Tragic
22.7%
Immigrants | Dominica
0.0
/100
|
#308
Tragic
22.7%
Houma
0.0
/100
|
#309
Tragic
22.7%
Africans
0.0
/100
|
#310
Tragic
22.8%
Seminole
0.0
/100
|
#311
Tragic
22.8%
Hondurans
0.0
/100
|
#312
Tragic
23.0%
Bahamians
0.0
/100
|
#313
Tragic
23.0%
U.S. Virgin Islanders
0.0
/100
|
#314
Tragic
23.0%
Arapaho
0.0
/100
|
#315
Tragic
23.1%
Yakama
0.0
/100
|
#316
Tragic
23.1%
Menominee
0.0
/100
|
#317
Tragic
23.3%
Dutch West Indians
0.0
/100
|
#318
Tragic
23.3%