Tohono O'odham vs Seminole Child Poverty Under the Age of 5
COMPARE
Tohono O'odham
Seminole
Child Poverty Under the Age of 5
Child Poverty Under the Age of 5 Comparison
Tohono O'odham
Seminole
29.5%
CHILD POVERTY UNDER THE AGE OF 5
0.0/ 100
METRIC RATING
342nd/ 347
METRIC RANK
22.8%
CHILD POVERTY UNDER THE AGE OF 5
0.0/ 100
METRIC RATING
311th/ 347
METRIC RANK
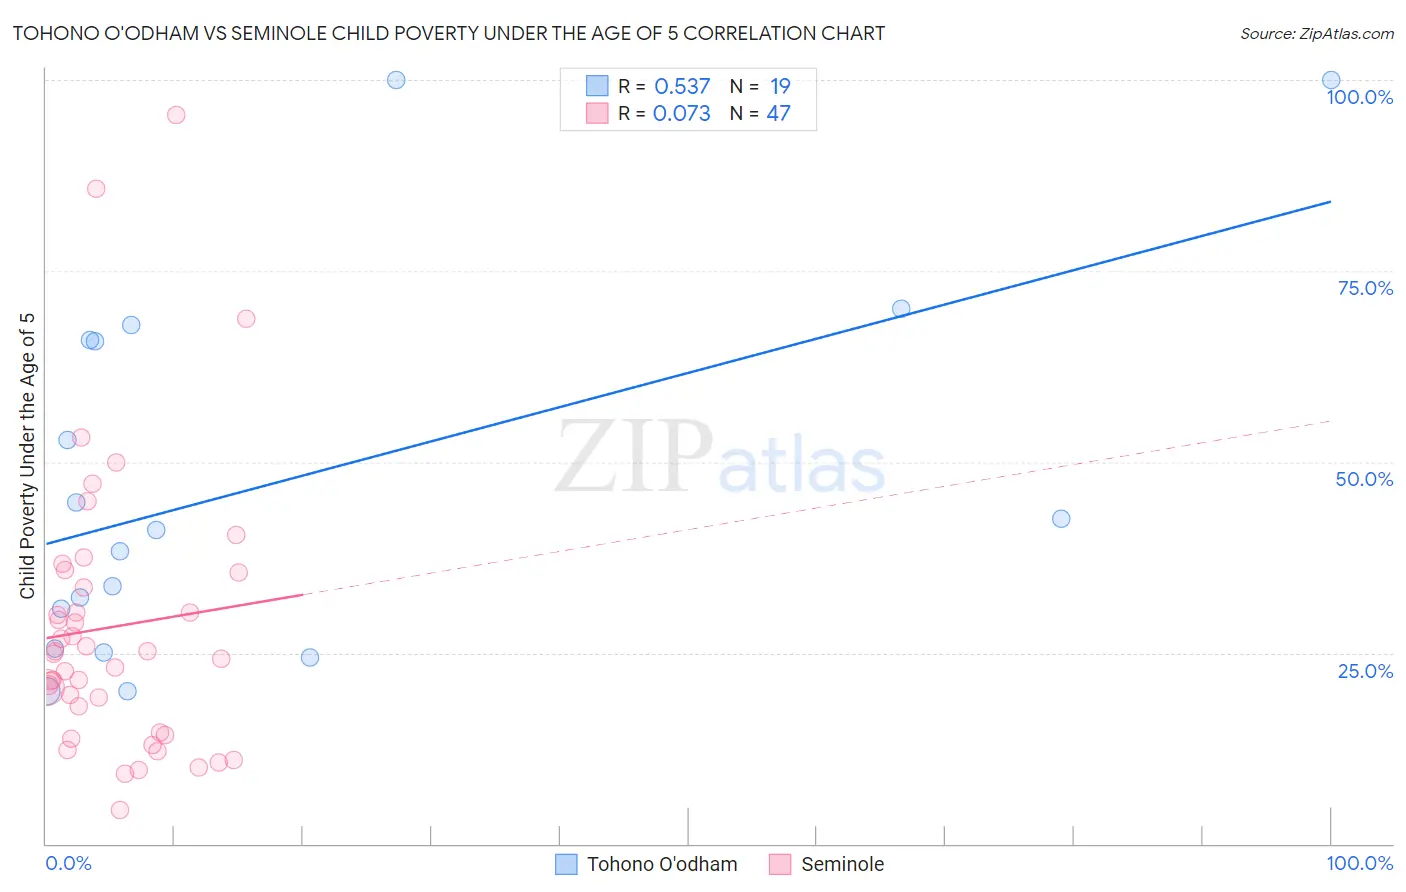
Tohono O'odham vs Seminole Child Poverty Under the Age of 5 Correlation Chart
The statistical analysis conducted on geographies consisting of 58,528,457 people shows a substantial positive correlation between the proportion of Tohono O'odham and poverty level among children under the age of 5 in the United States with a correlation coefficient (R) of 0.537 and weighted average of 29.5%. Similarly, the statistical analysis conducted on geographies consisting of 117,328,756 people shows a slight positive correlation between the proportion of Seminole and poverty level among children under the age of 5 in the United States with a correlation coefficient (R) of 0.073 and weighted average of 22.8%, a difference of 29.2%.
Child Poverty Under the Age of 5 Correlation Summary
| Measurement | Tohono O'odham | Seminole |
| Minimum | 19.9% | 4.3% |
| Maximum | 100.0% | 95.5% |
| Range | 80.1% | 91.1% |
| Mean | 47.4% | 28.4% |
| Median | 41.1% | 24.9% |
| Interquartile 25% (IQ1) | 25.5% | 14.6% |
| Interquartile 75% (IQ3) | 66.0% | 35.5% |
| Interquartile Range (IQR) | 40.4% | 20.9% |
| Standard Deviation (Sample) | 24.8% | 18.6% |
| Standard Deviation (Population) | 24.1% | 18.4% |
Similar Demographics by Child Poverty Under the Age of 5
Demographics Similar to Tohono O'odham by Child Poverty Under the Age of 5
In terms of child poverty under the age of 5, the demographic groups most similar to Tohono O'odham are Yuman (29.5%, a difference of 0.16%), Immigrants from Yemen (29.3%, a difference of 0.68%), Cheyenne (28.3%, a difference of 4.1%), Crow (31.0%, a difference of 5.1%), and Yup'ik (27.7%, a difference of 6.4%).
| Demographics | Rating | Rank | Child Poverty Under the Age of 5 |
| Natives/Alaskans | 0.0 /100 | #333 | Tragic 25.6% |
| Blacks/African Americans | 0.0 /100 | #334 | Tragic 25.7% |
| Colville | 0.0 /100 | #335 | Tragic 25.7% |
| Sioux | 0.0 /100 | #336 | Tragic 26.9% |
| Pima | 0.0 /100 | #337 | Tragic 27.4% |
| Hopi | 0.0 /100 | #338 | Tragic 27.7% |
| Yup'ik | 0.0 /100 | #339 | Tragic 27.7% |
| Cheyenne | 0.0 /100 | #340 | Tragic 28.3% |
| Immigrants | Yemen | 0.0 /100 | #341 | Tragic 29.3% |
| Tohono O'odham | 0.0 /100 | #342 | Tragic 29.5% |
| Yuman | 0.0 /100 | #343 | Tragic 29.5% |
| Crow | 0.0 /100 | #344 | Tragic 31.0% |
| Navajo | 0.0 /100 | #345 | Tragic 31.6% |
| Lumbee | 0.0 /100 | #346 | Tragic 33.3% |
| Puerto Ricans | 0.0 /100 | #347 | Tragic 34.5% |
Demographics Similar to Seminole by Child Poverty Under the Age of 5
In terms of child poverty under the age of 5, the demographic groups most similar to Seminole are African (22.8%, a difference of 0.050%), Houma (22.7%, a difference of 0.45%), Immigrants from Dominica (22.7%, a difference of 0.59%), Honduran (23.0%, a difference of 0.60%), and Immigrants from Bahamas (22.7%, a difference of 0.63%).
| Demographics | Rating | Rank | Child Poverty Under the Age of 5 |
| Immigrants | Guatemala | 0.0 /100 | #304 | Tragic 22.0% |
| Immigrants | Mexico | 0.0 /100 | #305 | Tragic 22.2% |
| Indonesians | 0.0 /100 | #306 | Tragic 22.3% |
| Immigrants | Bahamas | 0.0 /100 | #307 | Tragic 22.7% |
| Immigrants | Dominica | 0.0 /100 | #308 | Tragic 22.7% |
| Houma | 0.0 /100 | #309 | Tragic 22.7% |
| Africans | 0.0 /100 | #310 | Tragic 22.8% |
| Seminole | 0.0 /100 | #311 | Tragic 22.8% |
| Hondurans | 0.0 /100 | #312 | Tragic 23.0% |
| Bahamians | 0.0 /100 | #313 | Tragic 23.0% |
| U.S. Virgin Islanders | 0.0 /100 | #314 | Tragic 23.0% |
| Arapaho | 0.0 /100 | #315 | Tragic 23.1% |
| Yakama | 0.0 /100 | #316 | Tragic 23.1% |
| Menominee | 0.0 /100 | #317 | Tragic 23.3% |
| Dutch West Indians | 0.0 /100 | #318 | Tragic 23.3% |