Soviet Union vs Seminole Child Poverty Under the Age of 5
COMPARE
Soviet Union
Seminole
Child Poverty Under the Age of 5
Child Poverty Under the Age of 5 Comparison
Soviet Union
Seminole
14.7%
CHILD POVERTY UNDER THE AGE OF 5
99.7/ 100
METRIC RATING
42nd/ 347
METRIC RANK
22.8%
CHILD POVERTY UNDER THE AGE OF 5
0.0/ 100
METRIC RATING
311th/ 347
METRIC RANK
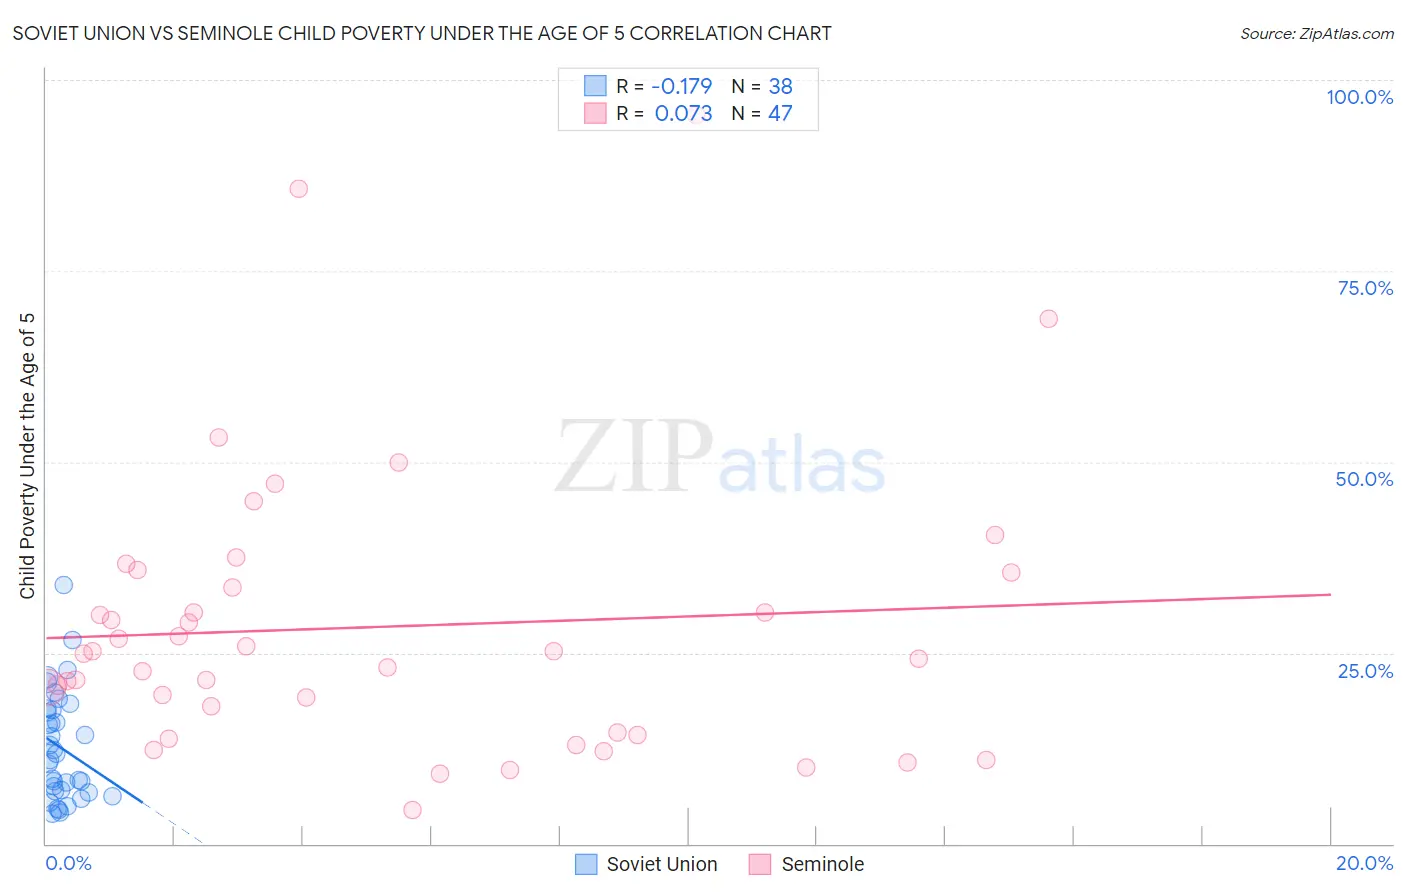
Soviet Union vs Seminole Child Poverty Under the Age of 5 Correlation Chart
The statistical analysis conducted on geographies consisting of 43,034,712 people shows a poor negative correlation between the proportion of Soviet Union and poverty level among children under the age of 5 in the United States with a correlation coefficient (R) of -0.179 and weighted average of 14.7%. Similarly, the statistical analysis conducted on geographies consisting of 117,328,756 people shows a slight positive correlation between the proportion of Seminole and poverty level among children under the age of 5 in the United States with a correlation coefficient (R) of 0.073 and weighted average of 22.8%, a difference of 55.4%.
Child Poverty Under the Age of 5 Correlation Summary
| Measurement | Soviet Union | Seminole |
| Minimum | 3.9% | 4.3% |
| Maximum | 33.8% | 95.5% |
| Range | 29.9% | 91.1% |
| Mean | 12.6% | 28.4% |
| Median | 11.3% | 24.9% |
| Interquartile 25% (IQ1) | 6.9% | 14.6% |
| Interquartile 75% (IQ3) | 17.4% | 35.5% |
| Interquartile Range (IQR) | 10.5% | 20.9% |
| Standard Deviation (Sample) | 7.0% | 18.6% |
| Standard Deviation (Population) | 7.0% | 18.4% |
Similar Demographics by Child Poverty Under the Age of 5
Demographics Similar to Soviet Union by Child Poverty Under the Age of 5
In terms of child poverty under the age of 5, the demographic groups most similar to Soviet Union are Immigrants from Greece (14.7%, a difference of 0.0%), Immigrants from Philippines (14.7%, a difference of 0.13%), Immigrants from Belarus (14.7%, a difference of 0.16%), Laotian (14.7%, a difference of 0.26%), and Immigrants from Australia (14.6%, a difference of 0.28%).
| Demographics | Rating | Rank | Child Poverty Under the Age of 5 |
| Latvians | 99.8 /100 | #35 | Exceptional 14.5% |
| Maltese | 99.8 /100 | #36 | Exceptional 14.5% |
| Turks | 99.7 /100 | #37 | Exceptional 14.6% |
| Eastern Europeans | 99.7 /100 | #38 | Exceptional 14.6% |
| Norwegians | 99.7 /100 | #39 | Exceptional 14.6% |
| Immigrants | Australia | 99.7 /100 | #40 | Exceptional 14.6% |
| Immigrants | Belarus | 99.7 /100 | #41 | Exceptional 14.7% |
| Soviet Union | 99.7 /100 | #42 | Exceptional 14.7% |
| Immigrants | Greece | 99.7 /100 | #43 | Exceptional 14.7% |
| Immigrants | Philippines | 99.7 /100 | #44 | Exceptional 14.7% |
| Laotians | 99.6 /100 | #45 | Exceptional 14.7% |
| Tsimshian | 99.6 /100 | #46 | Exceptional 14.7% |
| Russians | 99.6 /100 | #47 | Exceptional 14.8% |
| Immigrants | Czechoslovakia | 99.6 /100 | #48 | Exceptional 14.8% |
| Immigrants | Bulgaria | 99.6 /100 | #49 | Exceptional 14.8% |
Demographics Similar to Seminole by Child Poverty Under the Age of 5
In terms of child poverty under the age of 5, the demographic groups most similar to Seminole are African (22.8%, a difference of 0.050%), Houma (22.7%, a difference of 0.45%), Immigrants from Dominica (22.7%, a difference of 0.59%), Honduran (23.0%, a difference of 0.60%), and Immigrants from Bahamas (22.7%, a difference of 0.63%).
| Demographics | Rating | Rank | Child Poverty Under the Age of 5 |
| Immigrants | Guatemala | 0.0 /100 | #304 | Tragic 22.0% |
| Immigrants | Mexico | 0.0 /100 | #305 | Tragic 22.2% |
| Indonesians | 0.0 /100 | #306 | Tragic 22.3% |
| Immigrants | Bahamas | 0.0 /100 | #307 | Tragic 22.7% |
| Immigrants | Dominica | 0.0 /100 | #308 | Tragic 22.7% |
| Houma | 0.0 /100 | #309 | Tragic 22.7% |
| Africans | 0.0 /100 | #310 | Tragic 22.8% |
| Seminole | 0.0 /100 | #311 | Tragic 22.8% |
| Hondurans | 0.0 /100 | #312 | Tragic 23.0% |
| Bahamians | 0.0 /100 | #313 | Tragic 23.0% |
| U.S. Virgin Islanders | 0.0 /100 | #314 | Tragic 23.0% |
| Arapaho | 0.0 /100 | #315 | Tragic 23.1% |
| Yakama | 0.0 /100 | #316 | Tragic 23.1% |
| Menominee | 0.0 /100 | #317 | Tragic 23.3% |
| Dutch West Indians | 0.0 /100 | #318 | Tragic 23.3% |