Immigrants from Nepal vs Navajo Male Poverty
COMPARE
Immigrants from Nepal
Navajo
Male Poverty
Male Poverty Comparison
Immigrants from Nepal
Navajo
11.0%
MALE POVERTY
67.3/ 100
METRIC RATING
152nd/ 347
METRIC RANK
22.3%
MALE POVERTY
0.0/ 100
METRIC RATING
346th/ 347
METRIC RANK
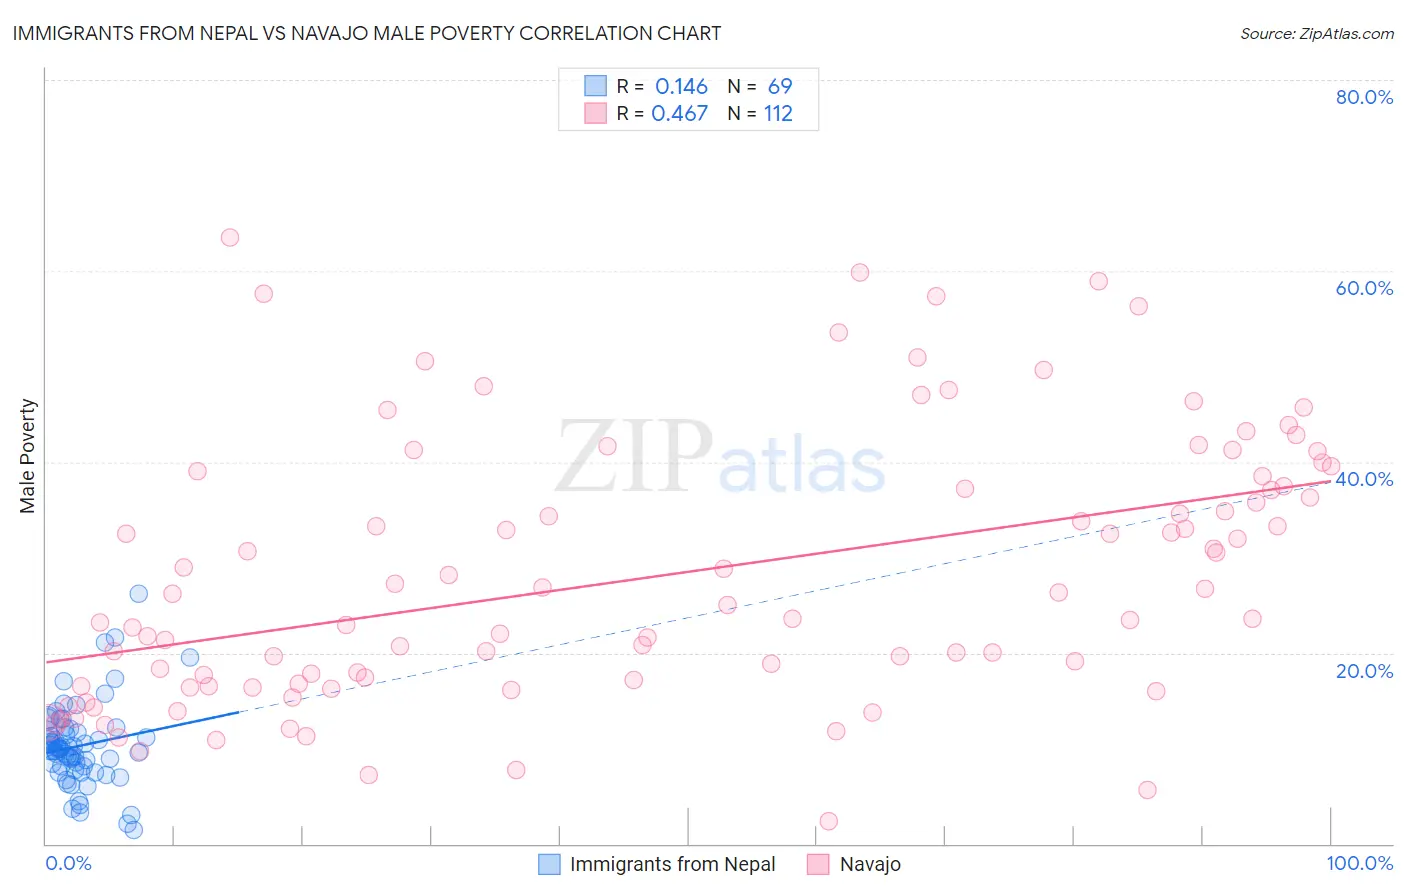
Immigrants from Nepal vs Navajo Male Poverty Correlation Chart
The statistical analysis conducted on geographies consisting of 186,636,323 people shows a poor positive correlation between the proportion of Immigrants from Nepal and poverty level among males in the United States with a correlation coefficient (R) of 0.146 and weighted average of 11.0%. Similarly, the statistical analysis conducted on geographies consisting of 224,713,606 people shows a moderate positive correlation between the proportion of Navajo and poverty level among males in the United States with a correlation coefficient (R) of 0.467 and weighted average of 22.3%, a difference of 103.0%.
Male Poverty Correlation Summary
| Measurement | Immigrants from Nepal | Navajo |
| Minimum | 1.5% | 2.3% |
| Maximum | 26.3% | 63.5% |
| Range | 24.7% | 61.2% |
| Mean | 10.3% | 28.1% |
| Median | 9.9% | 25.6% |
| Interquartile 25% (IQ1) | 7.9% | 16.6% |
| Interquartile 75% (IQ3) | 11.9% | 38.0% |
| Interquartile Range (IQR) | 4.0% | 21.4% |
| Standard Deviation (Sample) | 4.4% | 13.9% |
| Standard Deviation (Population) | 4.4% | 13.9% |
Similar Demographics by Male Poverty
Demographics Similar to Immigrants from Nepal by Male Poverty
In terms of male poverty, the demographic groups most similar to Immigrants from Nepal are Venezuelan (11.0%, a difference of 0.0%), Guamanian/Chamorro (11.0%, a difference of 0.030%), Immigrants from Venezuela (11.0%, a difference of 0.070%), Armenian (11.0%, a difference of 0.080%), and Icelander (11.0%, a difference of 0.14%).
| Demographics | Rating | Rank | Male Poverty |
| Immigrants | Germany | 71.6 /100 | #145 | Good 10.9% |
| Syrians | 71.4 /100 | #146 | Good 10.9% |
| Icelanders | 68.5 /100 | #147 | Good 11.0% |
| Armenians | 68.0 /100 | #148 | Good 11.0% |
| Immigrants | Venezuela | 67.9 /100 | #149 | Good 11.0% |
| Guamanians/Chamorros | 67.6 /100 | #150 | Good 11.0% |
| Venezuelans | 67.4 /100 | #151 | Good 11.0% |
| Immigrants | Nepal | 67.3 /100 | #152 | Good 11.0% |
| Immigrants | Bosnia and Herzegovina | 65.2 /100 | #153 | Good 11.0% |
| Immigrants | Kazakhstan | 64.8 /100 | #154 | Good 11.0% |
| Immigrants | Malaysia | 64.7 /100 | #155 | Good 11.0% |
| Costa Ricans | 63.9 /100 | #156 | Good 11.0% |
| Scotch-Irish | 63.7 /100 | #157 | Good 11.0% |
| Colombians | 63.0 /100 | #158 | Good 11.0% |
| Taiwanese | 62.7 /100 | #159 | Good 11.0% |
Demographics Similar to Navajo by Male Poverty
In terms of male poverty, the demographic groups most similar to Navajo are Puerto Rican (22.0%, a difference of 1.3%), Tohono O'odham (22.9%, a difference of 2.6%), Hopi (20.8%, a difference of 7.2%), Yup'ik (20.4%, a difference of 9.4%), and Pima (20.4%, a difference of 9.6%).
| Demographics | Rating | Rank | Male Poverty |
| Natives/Alaskans | 0.0 /100 | #333 | Tragic 16.9% |
| Cheyenne | 0.0 /100 | #334 | Tragic 17.6% |
| Apache | 0.0 /100 | #335 | Tragic 17.7% |
| Pueblo | 0.0 /100 | #336 | Tragic 18.5% |
| Sioux | 0.0 /100 | #337 | Tragic 18.7% |
| Crow | 0.0 /100 | #338 | Tragic 19.1% |
| Yuman | 0.0 /100 | #339 | Tragic 19.5% |
| Immigrants | Yemen | 0.0 /100 | #340 | Tragic 20.1% |
| Lumbee | 0.0 /100 | #341 | Tragic 20.2% |
| Pima | 0.0 /100 | #342 | Tragic 20.4% |
| Yup'ik | 0.0 /100 | #343 | Tragic 20.4% |
| Hopi | 0.0 /100 | #344 | Tragic 20.8% |
| Puerto Ricans | 0.0 /100 | #345 | Tragic 22.0% |
| Navajo | 0.0 /100 | #346 | Tragic 22.3% |
| Tohono O'odham | 0.0 /100 | #347 | Tragic 22.9% |