British West Indian vs Navajo Unemployment
COMPARE
British West Indian
Navajo
Unemployment
Unemployment Comparison
British West Indians
Navajo
6.8%
UNEMPLOYMENT
0.0/ 100
METRIC RATING
319th/ 347
METRIC RANK
8.4%
UNEMPLOYMENT
0.0/ 100
METRIC RATING
339th/ 347
METRIC RANK
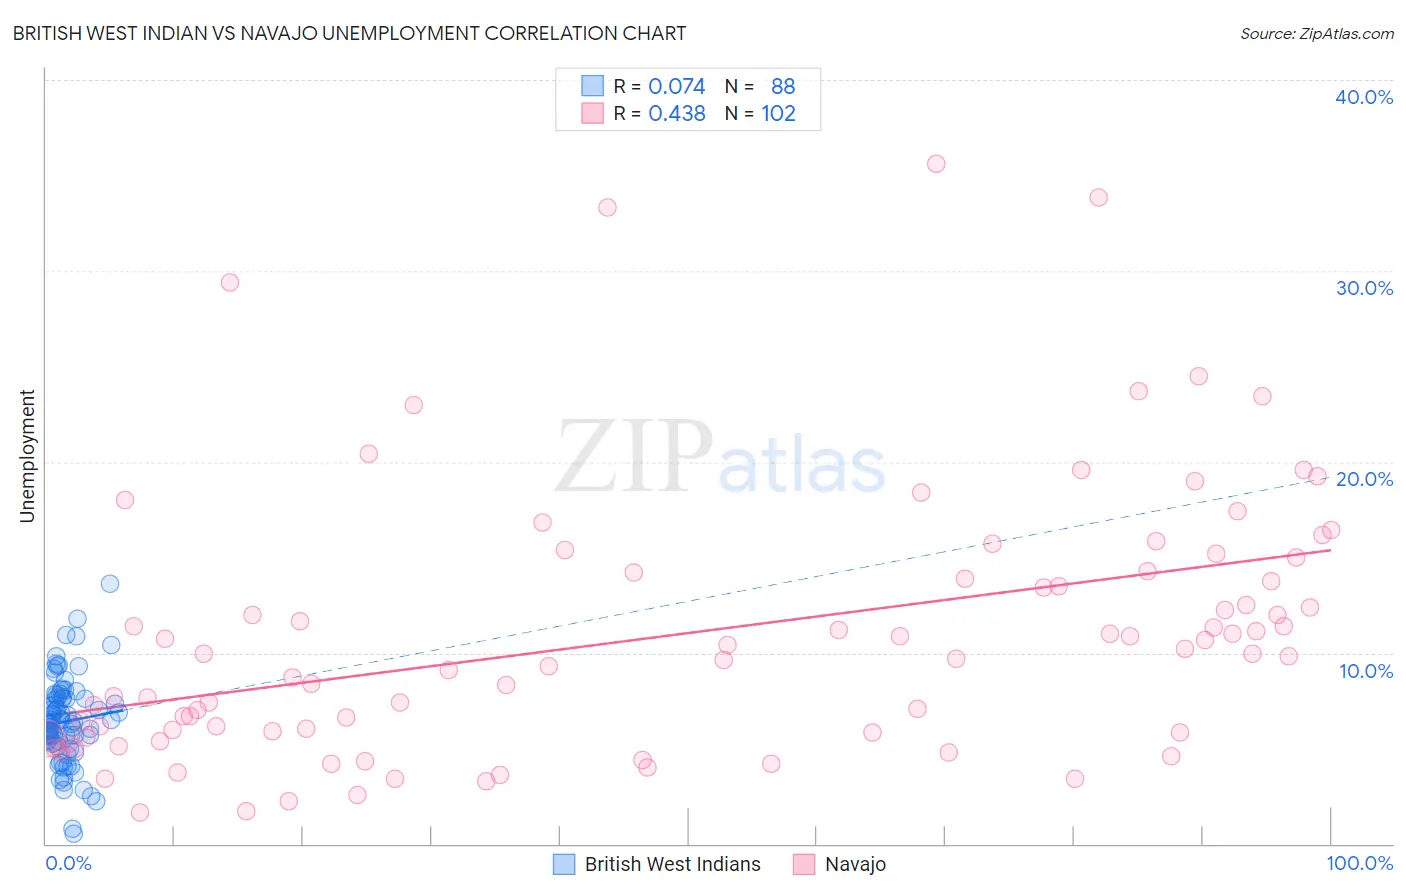
British West Indian vs Navajo Unemployment Correlation Chart
The statistical analysis conducted on geographies consisting of 152,665,255 people shows a slight positive correlation between the proportion of British West Indians and unemployment in the United States with a correlation coefficient (R) of 0.074 and weighted average of 6.8%. Similarly, the statistical analysis conducted on geographies consisting of 224,594,128 people shows a moderate positive correlation between the proportion of Navajo and unemployment in the United States with a correlation coefficient (R) of 0.438 and weighted average of 8.4%, a difference of 22.2%.
Unemployment Correlation Summary
| Measurement | British West Indian | Navajo |
| Minimum | 0.50% | 1.6% |
| Maximum | 13.6% | 35.6% |
| Range | 13.1% | 34.0% |
| Mean | 6.4% | 10.9% |
| Median | 6.3% | 9.9% |
| Interquartile 25% (IQ1) | 5.3% | 5.8% |
| Interquartile 75% (IQ3) | 7.6% | 14.2% |
| Interquartile Range (IQR) | 2.3% | 8.4% |
| Standard Deviation (Sample) | 2.3% | 7.0% |
| Standard Deviation (Population) | 2.3% | 7.0% |
Demographics Similar to British West Indians and Navajo by Unemployment
In terms of unemployment, the demographic groups most similar to British West Indians are Immigrants from St. Vincent and the Grenadines (6.9%, a difference of 0.79%), Immigrants from Guyana (6.9%, a difference of 0.81%), Guyanese (6.9%, a difference of 0.85%), Immigrants from Grenada (6.9%, a difference of 1.2%), and Immigrants from Armenia (7.0%, a difference of 2.3%). Similarly, the demographic groups most similar to Navajo are Pima (8.2%, a difference of 1.6%), Cheyenne (8.0%, a difference of 4.4%), Immigrants from Yemen (7.7%, a difference of 8.4%), Alaskan Athabascan (7.7%, a difference of 9.1%), and Apache (7.4%, a difference of 12.4%).
| Demographics | Rating | Rank | Unemployment |
| British West Indians | 0.0 /100 | #319 | Tragic 6.8% |
| Immigrants | St. Vincent and the Grenadines | 0.0 /100 | #320 | Tragic 6.9% |
| Immigrants | Guyana | 0.0 /100 | #321 | Tragic 6.9% |
| Guyanese | 0.0 /100 | #322 | Tragic 6.9% |
| Immigrants | Grenada | 0.0 /100 | #323 | Tragic 6.9% |
| Immigrants | Armenia | 0.0 /100 | #324 | Tragic 7.0% |
| Natives/Alaskans | 0.0 /100 | #325 | Tragic 7.0% |
| Paiute | 0.0 /100 | #326 | Tragic 7.1% |
| Pueblo | 0.0 /100 | #327 | Tragic 7.2% |
| Tsimshian | 0.0 /100 | #328 | Tragic 7.2% |
| Alaska Natives | 0.0 /100 | #329 | Tragic 7.2% |
| Yakama | 0.0 /100 | #330 | Tragic 7.3% |
| Dominicans | 0.0 /100 | #331 | Tragic 7.4% |
| Sioux | 0.0 /100 | #332 | Tragic 7.4% |
| Immigrants | Dominican Republic | 0.0 /100 | #333 | Tragic 7.4% |
| Apache | 0.0 /100 | #334 | Tragic 7.4% |
| Alaskan Athabascans | 0.0 /100 | #335 | Tragic 7.7% |
| Immigrants | Yemen | 0.0 /100 | #336 | Tragic 7.7% |
| Cheyenne | 0.0 /100 | #337 | Tragic 8.0% |
| Pima | 0.0 /100 | #338 | Tragic 8.2% |
| Navajo | 0.0 /100 | #339 | Tragic 8.4% |