British vs Arapaho Female Poverty Among 25-34 Year Olds
COMPARE
British
Arapaho
Female Poverty Among 25-34 Year Olds
Female Poverty Among 25-34 Year Olds Comparison
British
Arapaho
13.4%
FEMALE POVERTY AMONG 25-34 YEAR OLDS
63.5/ 100
METRIC RATING
163rd/ 347
METRIC RANK
17.8%
FEMALE POVERTY AMONG 25-34 YEAR OLDS
0.0/ 100
METRIC RATING
317th/ 347
METRIC RANK
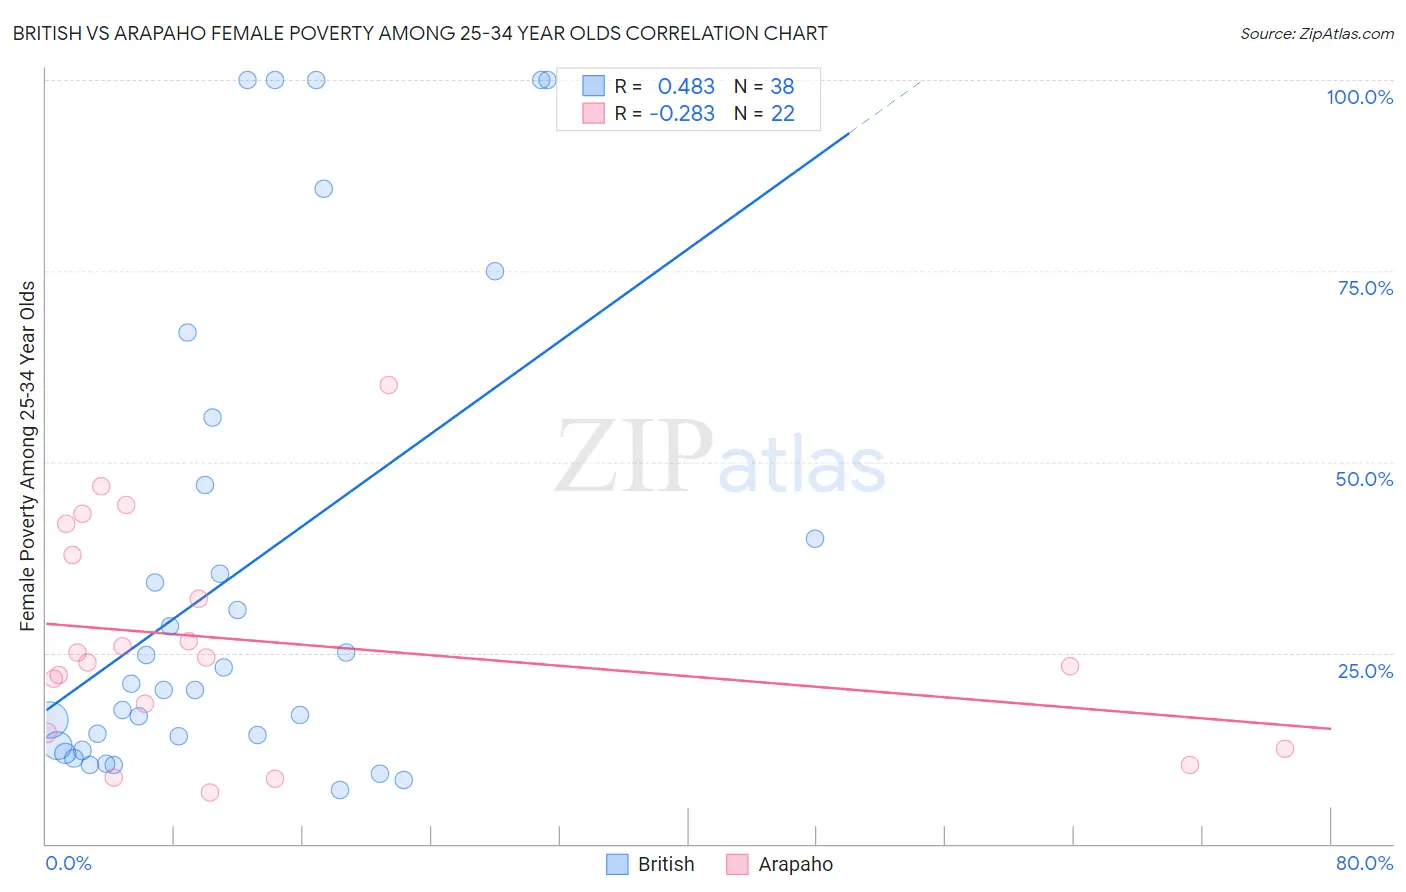
British vs Arapaho Female Poverty Among 25-34 Year Olds Correlation Chart
The statistical analysis conducted on geographies consisting of 515,268,624 people shows a moderate positive correlation between the proportion of British and poverty level among females between the ages 25 and 34 in the United States with a correlation coefficient (R) of 0.483 and weighted average of 13.4%. Similarly, the statistical analysis conducted on geographies consisting of 29,697,877 people shows a weak negative correlation between the proportion of Arapaho and poverty level among females between the ages 25 and 34 in the United States with a correlation coefficient (R) of -0.283 and weighted average of 17.8%, a difference of 32.8%.
Female Poverty Among 25-34 Year Olds Correlation Summary
| Measurement | British | Arapaho |
| Minimum | 7.0% | 6.7% |
| Maximum | 100.0% | 60.0% |
| Range | 93.0% | 53.3% |
| Mean | 35.4% | 26.3% |
| Median | 20.6% | 24.1% |
| Interquartile 25% (IQ1) | 12.8% | 14.6% |
| Interquartile 75% (IQ3) | 46.9% | 37.8% |
| Interquartile Range (IQR) | 34.1% | 23.2% |
| Standard Deviation (Sample) | 31.5% | 14.3% |
| Standard Deviation (Population) | 31.1% | 14.0% |
Similar Demographics by Female Poverty Among 25-34 Year Olds
Demographics Similar to British by Female Poverty Among 25-34 Year Olds
In terms of female poverty among 25-34 year olds, the demographic groups most similar to British are Ugandan (13.4%, a difference of 0.050%), Swiss (13.4%, a difference of 0.16%), Icelander (13.3%, a difference of 0.20%), Immigrants from South America (13.3%, a difference of 0.26%), and Uruguayan (13.3%, a difference of 0.32%).
| Demographics | Rating | Rank | Female Poverty Among 25-34 Year Olds |
| Immigrants | Cameroon | 72.0 /100 | #156 | Good 13.3% |
| Immigrants | Western Europe | 70.3 /100 | #157 | Good 13.3% |
| Immigrants | Colombia | 69.2 /100 | #158 | Good 13.3% |
| Uruguayans | 66.9 /100 | #159 | Good 13.3% |
| Immigrants | South America | 66.3 /100 | #160 | Good 13.3% |
| Icelanders | 65.7 /100 | #161 | Good 13.3% |
| Ugandans | 64.1 /100 | #162 | Good 13.4% |
| British | 63.5 /100 | #163 | Good 13.4% |
| Swiss | 61.7 /100 | #164 | Good 13.4% |
| Basques | 59.3 /100 | #165 | Average 13.4% |
| Belgians | 58.9 /100 | #166 | Average 13.4% |
| Immigrants | Bosnia and Herzegovina | 58.6 /100 | #167 | Average 13.4% |
| Immigrants | Afghanistan | 57.7 /100 | #168 | Average 13.4% |
| Samoans | 56.8 /100 | #169 | Average 13.5% |
| Immigrants | Uganda | 53.0 /100 | #170 | Average 13.5% |
Demographics Similar to Arapaho by Female Poverty Among 25-34 Year Olds
In terms of female poverty among 25-34 year olds, the demographic groups most similar to Arapaho are Ute (17.9%, a difference of 0.60%), Yakama (17.6%, a difference of 0.79%), Dominican (17.6%, a difference of 0.79%), Immigrants from Dominican Republic (17.6%, a difference of 1.0%), and Menominee (18.0%, a difference of 1.1%).
| Demographics | Rating | Rank | Female Poverty Among 25-34 Year Olds |
| Cherokee | 0.0 /100 | #310 | Tragic 17.2% |
| Immigrants | Honduras | 0.0 /100 | #311 | Tragic 17.3% |
| Iroquois | 0.0 /100 | #312 | Tragic 17.5% |
| Colville | 0.0 /100 | #313 | Tragic 17.5% |
| Immigrants | Dominican Republic | 0.0 /100 | #314 | Tragic 17.6% |
| Yakama | 0.0 /100 | #315 | Tragic 17.6% |
| Dominicans | 0.0 /100 | #316 | Tragic 17.6% |
| Arapaho | 0.0 /100 | #317 | Tragic 17.8% |
| Ute | 0.0 /100 | #318 | Tragic 17.9% |
| Menominee | 0.0 /100 | #319 | Tragic 18.0% |
| Chippewa | 0.0 /100 | #320 | Tragic 18.0% |
| Choctaw | 0.0 /100 | #321 | Tragic 18.1% |
| Central American Indians | 0.0 /100 | #322 | Tragic 18.2% |
| Seminole | 0.0 /100 | #323 | Tragic 18.3% |
| Dutch West Indians | 0.0 /100 | #324 | Tragic 18.4% |