British vs Jordanian Female Poverty Among 25-34 Year Olds
COMPARE
British
Jordanian
Female Poverty Among 25-34 Year Olds
Female Poverty Among 25-34 Year Olds Comparison
British
Jordanians
13.4%
FEMALE POVERTY AMONG 25-34 YEAR OLDS
63.5/ 100
METRIC RATING
163rd/ 347
METRIC RANK
12.1%
FEMALE POVERTY AMONG 25-34 YEAR OLDS
99.4/ 100
METRIC RATING
57th/ 347
METRIC RANK
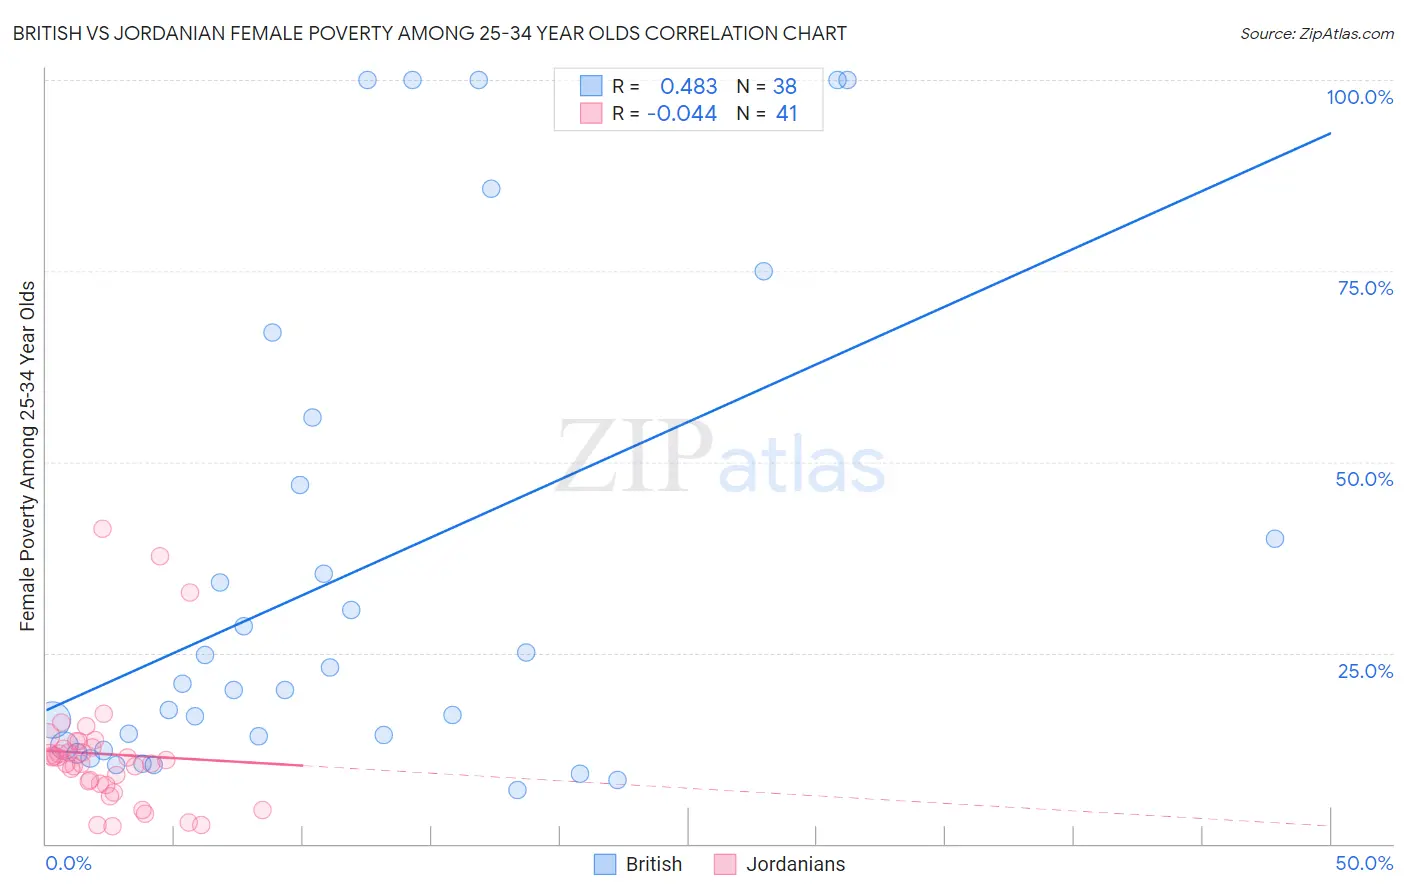
British vs Jordanian Female Poverty Among 25-34 Year Olds Correlation Chart
The statistical analysis conducted on geographies consisting of 515,268,624 people shows a moderate positive correlation between the proportion of British and poverty level among females between the ages 25 and 34 in the United States with a correlation coefficient (R) of 0.483 and weighted average of 13.4%. Similarly, the statistical analysis conducted on geographies consisting of 165,610,888 people shows no correlation between the proportion of Jordanians and poverty level among females between the ages 25 and 34 in the United States with a correlation coefficient (R) of -0.044 and weighted average of 12.1%, a difference of 10.8%.
Female Poverty Among 25-34 Year Olds Correlation Summary
| Measurement | British | Jordanian |
| Minimum | 7.0% | 2.3% |
| Maximum | 100.0% | 41.2% |
| Range | 93.0% | 39.0% |
| Mean | 35.4% | 11.7% |
| Median | 20.6% | 11.0% |
| Interquartile 25% (IQ1) | 12.8% | 7.8% |
| Interquartile 75% (IQ3) | 46.9% | 13.0% |
| Interquartile Range (IQR) | 34.1% | 5.2% |
| Standard Deviation (Sample) | 31.5% | 8.2% |
| Standard Deviation (Population) | 31.1% | 8.1% |
Similar Demographics by Female Poverty Among 25-34 Year Olds
Demographics Similar to British by Female Poverty Among 25-34 Year Olds
In terms of female poverty among 25-34 year olds, the demographic groups most similar to British are Ugandan (13.4%, a difference of 0.050%), Swiss (13.4%, a difference of 0.16%), Icelander (13.3%, a difference of 0.20%), Immigrants from South America (13.3%, a difference of 0.26%), and Uruguayan (13.3%, a difference of 0.32%).
| Demographics | Rating | Rank | Female Poverty Among 25-34 Year Olds |
| Immigrants | Cameroon | 72.0 /100 | #156 | Good 13.3% |
| Immigrants | Western Europe | 70.3 /100 | #157 | Good 13.3% |
| Immigrants | Colombia | 69.2 /100 | #158 | Good 13.3% |
| Uruguayans | 66.9 /100 | #159 | Good 13.3% |
| Immigrants | South America | 66.3 /100 | #160 | Good 13.3% |
| Icelanders | 65.7 /100 | #161 | Good 13.3% |
| Ugandans | 64.1 /100 | #162 | Good 13.4% |
| British | 63.5 /100 | #163 | Good 13.4% |
| Swiss | 61.7 /100 | #164 | Good 13.4% |
| Basques | 59.3 /100 | #165 | Average 13.4% |
| Belgians | 58.9 /100 | #166 | Average 13.4% |
| Immigrants | Bosnia and Herzegovina | 58.6 /100 | #167 | Average 13.4% |
| Immigrants | Afghanistan | 57.7 /100 | #168 | Average 13.4% |
| Samoans | 56.8 /100 | #169 | Average 13.5% |
| Immigrants | Uganda | 53.0 /100 | #170 | Average 13.5% |
Demographics Similar to Jordanians by Female Poverty Among 25-34 Year Olds
In terms of female poverty among 25-34 year olds, the demographic groups most similar to Jordanians are Luxembourger (12.1%, a difference of 0.020%), Immigrants from Romania (12.1%, a difference of 0.21%), Russian (12.1%, a difference of 0.21%), Immigrants from Northern Europe (12.1%, a difference of 0.29%), and Immigrants from Czechoslovakia (12.1%, a difference of 0.32%).
| Demographics | Rating | Rank | Female Poverty Among 25-34 Year Olds |
| Immigrants | Croatia | 99.6 /100 | #50 | Exceptional 12.0% |
| Paraguayans | 99.6 /100 | #51 | Exceptional 12.0% |
| Immigrants | Eastern Europe | 99.6 /100 | #52 | Exceptional 12.0% |
| Immigrants | Israel | 99.6 /100 | #53 | Exceptional 12.0% |
| Eastern Europeans | 99.6 /100 | #54 | Exceptional 12.0% |
| Immigrants | Philippines | 99.5 /100 | #55 | Exceptional 12.0% |
| Luxembourgers | 99.5 /100 | #56 | Exceptional 12.1% |
| Jordanians | 99.4 /100 | #57 | Exceptional 12.1% |
| Immigrants | Romania | 99.4 /100 | #58 | Exceptional 12.1% |
| Russians | 99.4 /100 | #59 | Exceptional 12.1% |
| Immigrants | Northern Europe | 99.4 /100 | #60 | Exceptional 12.1% |
| Immigrants | Czechoslovakia | 99.4 /100 | #61 | Exceptional 12.1% |
| Immigrants | Moldova | 99.3 /100 | #62 | Exceptional 12.1% |
| Soviet Union | 99.3 /100 | #63 | Exceptional 12.1% |
| Immigrants | Russia | 99.2 /100 | #64 | Exceptional 12.2% |