British vs Immigrants from Sudan Female Poverty Among 25-34 Year Olds
COMPARE
British
Immigrants from Sudan
Female Poverty Among 25-34 Year Olds
Female Poverty Among 25-34 Year Olds Comparison
British
Immigrants from Sudan
13.4%
FEMALE POVERTY AMONG 25-34 YEAR OLDS
63.5/ 100
METRIC RATING
163rd/ 347
METRIC RANK
14.4%
FEMALE POVERTY AMONG 25-34 YEAR OLDS
4.0/ 100
METRIC RATING
224th/ 347
METRIC RANK
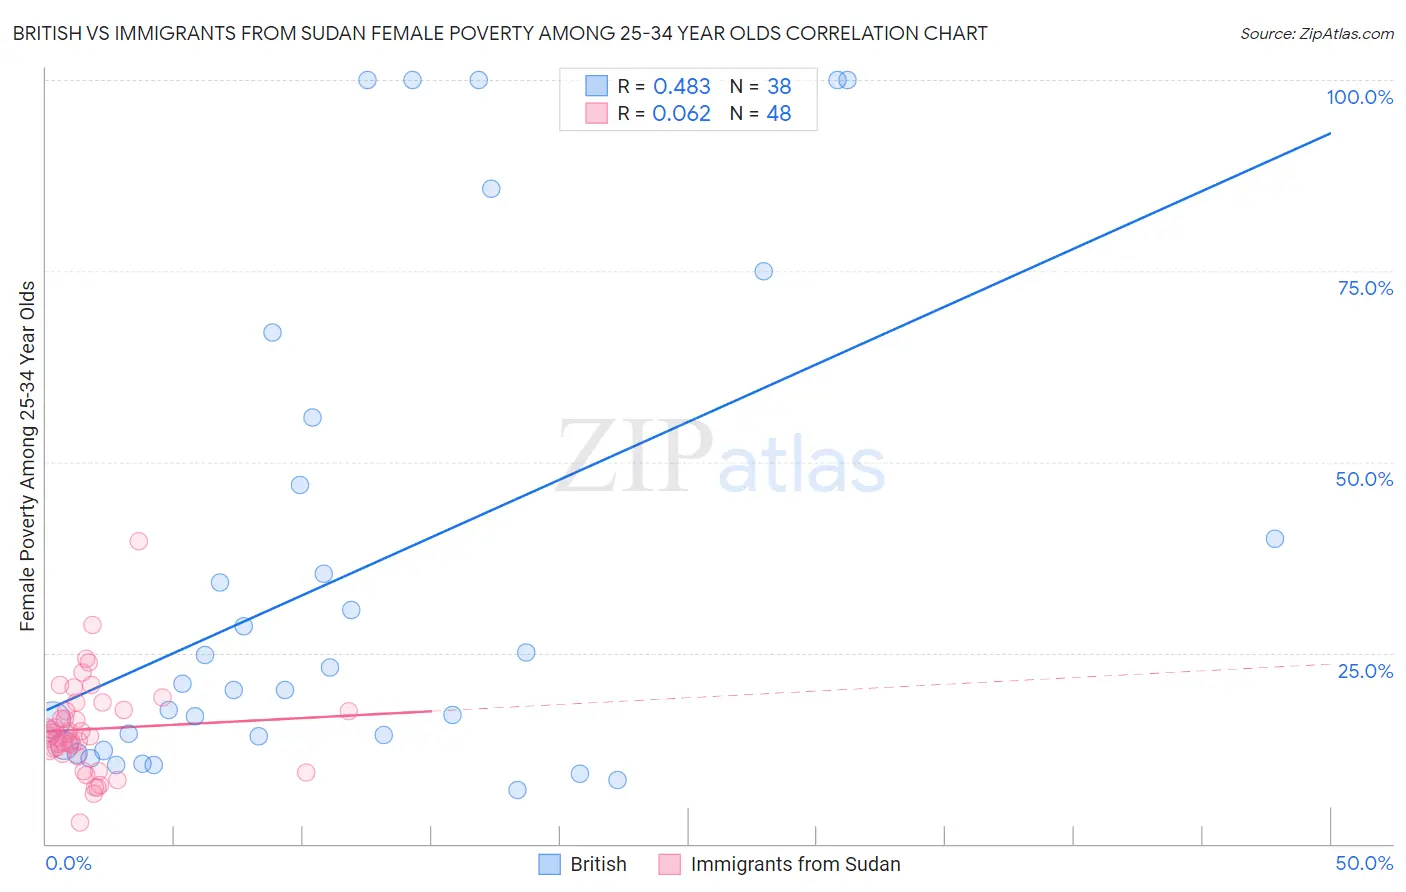
British vs Immigrants from Sudan Female Poverty Among 25-34 Year Olds Correlation Chart
The statistical analysis conducted on geographies consisting of 515,268,624 people shows a moderate positive correlation between the proportion of British and poverty level among females between the ages 25 and 34 in the United States with a correlation coefficient (R) of 0.483 and weighted average of 13.4%. Similarly, the statistical analysis conducted on geographies consisting of 118,579,963 people shows a slight positive correlation between the proportion of Immigrants from Sudan and poverty level among females between the ages 25 and 34 in the United States with a correlation coefficient (R) of 0.062 and weighted average of 14.4%, a difference of 7.8%.
Female Poverty Among 25-34 Year Olds Correlation Summary
| Measurement | British | Immigrants from Sudan |
| Minimum | 7.0% | 2.8% |
| Maximum | 100.0% | 39.6% |
| Range | 93.0% | 36.9% |
| Mean | 35.4% | 15.0% |
| Median | 20.6% | 14.3% |
| Interquartile 25% (IQ1) | 12.8% | 12.0% |
| Interquartile 75% (IQ3) | 46.9% | 17.5% |
| Interquartile Range (IQR) | 34.1% | 5.5% |
| Standard Deviation (Sample) | 31.5% | 6.2% |
| Standard Deviation (Population) | 31.1% | 6.1% |
Similar Demographics by Female Poverty Among 25-34 Year Olds
Demographics Similar to British by Female Poverty Among 25-34 Year Olds
In terms of female poverty among 25-34 year olds, the demographic groups most similar to British are Ugandan (13.4%, a difference of 0.050%), Swiss (13.4%, a difference of 0.16%), Icelander (13.3%, a difference of 0.20%), Immigrants from South America (13.3%, a difference of 0.26%), and Uruguayan (13.3%, a difference of 0.32%).
| Demographics | Rating | Rank | Female Poverty Among 25-34 Year Olds |
| Immigrants | Cameroon | 72.0 /100 | #156 | Good 13.3% |
| Immigrants | Western Europe | 70.3 /100 | #157 | Good 13.3% |
| Immigrants | Colombia | 69.2 /100 | #158 | Good 13.3% |
| Uruguayans | 66.9 /100 | #159 | Good 13.3% |
| Immigrants | South America | 66.3 /100 | #160 | Good 13.3% |
| Icelanders | 65.7 /100 | #161 | Good 13.3% |
| Ugandans | 64.1 /100 | #162 | Good 13.4% |
| British | 63.5 /100 | #163 | Good 13.4% |
| Swiss | 61.7 /100 | #164 | Good 13.4% |
| Basques | 59.3 /100 | #165 | Average 13.4% |
| Belgians | 58.9 /100 | #166 | Average 13.4% |
| Immigrants | Bosnia and Herzegovina | 58.6 /100 | #167 | Average 13.4% |
| Immigrants | Afghanistan | 57.7 /100 | #168 | Average 13.4% |
| Samoans | 56.8 /100 | #169 | Average 13.5% |
| Immigrants | Uganda | 53.0 /100 | #170 | Average 13.5% |
Demographics Similar to Immigrants from Sudan by Female Poverty Among 25-34 Year Olds
In terms of female poverty among 25-34 year olds, the demographic groups most similar to Immigrants from Sudan are Nigerian (14.4%, a difference of 0.070%), Immigrants from Portugal (14.4%, a difference of 0.13%), Sudanese (14.4%, a difference of 0.20%), Immigrants from Barbados (14.5%, a difference of 0.32%), and Ghanaian (14.4%, a difference of 0.36%).
| Demographics | Rating | Rank | Female Poverty Among 25-34 Year Olds |
| Spanish American Indians | 5.5 /100 | #217 | Tragic 14.3% |
| Immigrants | Thailand | 5.2 /100 | #218 | Tragic 14.3% |
| Ecuadorians | 5.2 /100 | #219 | Tragic 14.3% |
| Ghanaians | 4.8 /100 | #220 | Tragic 14.4% |
| Sudanese | 4.4 /100 | #221 | Tragic 14.4% |
| Immigrants | Portugal | 4.3 /100 | #222 | Tragic 14.4% |
| Nigerians | 4.2 /100 | #223 | Tragic 14.4% |
| Immigrants | Sudan | 4.0 /100 | #224 | Tragic 14.4% |
| Immigrants | Barbados | 3.4 /100 | #225 | Tragic 14.5% |
| Nicaraguans | 3.3 /100 | #226 | Tragic 14.5% |
| Celtics | 2.8 /100 | #227 | Tragic 14.5% |
| Vietnamese | 2.6 /100 | #228 | Tragic 14.6% |
| Spanish | 2.5 /100 | #229 | Tragic 14.6% |
| Spaniards | 2.3 /100 | #230 | Tragic 14.6% |
| Delaware | 2.3 /100 | #231 | Tragic 14.6% |