British vs Hopi Female Poverty Among 25-34 Year Olds
COMPARE
British
Hopi
Female Poverty Among 25-34 Year Olds
Female Poverty Among 25-34 Year Olds Comparison
British
Hopi
13.4%
FEMALE POVERTY AMONG 25-34 YEAR OLDS
63.5/ 100
METRIC RATING
163rd/ 347
METRIC RANK
23.7%
FEMALE POVERTY AMONG 25-34 YEAR OLDS
0.0/ 100
METRIC RATING
342nd/ 347
METRIC RANK
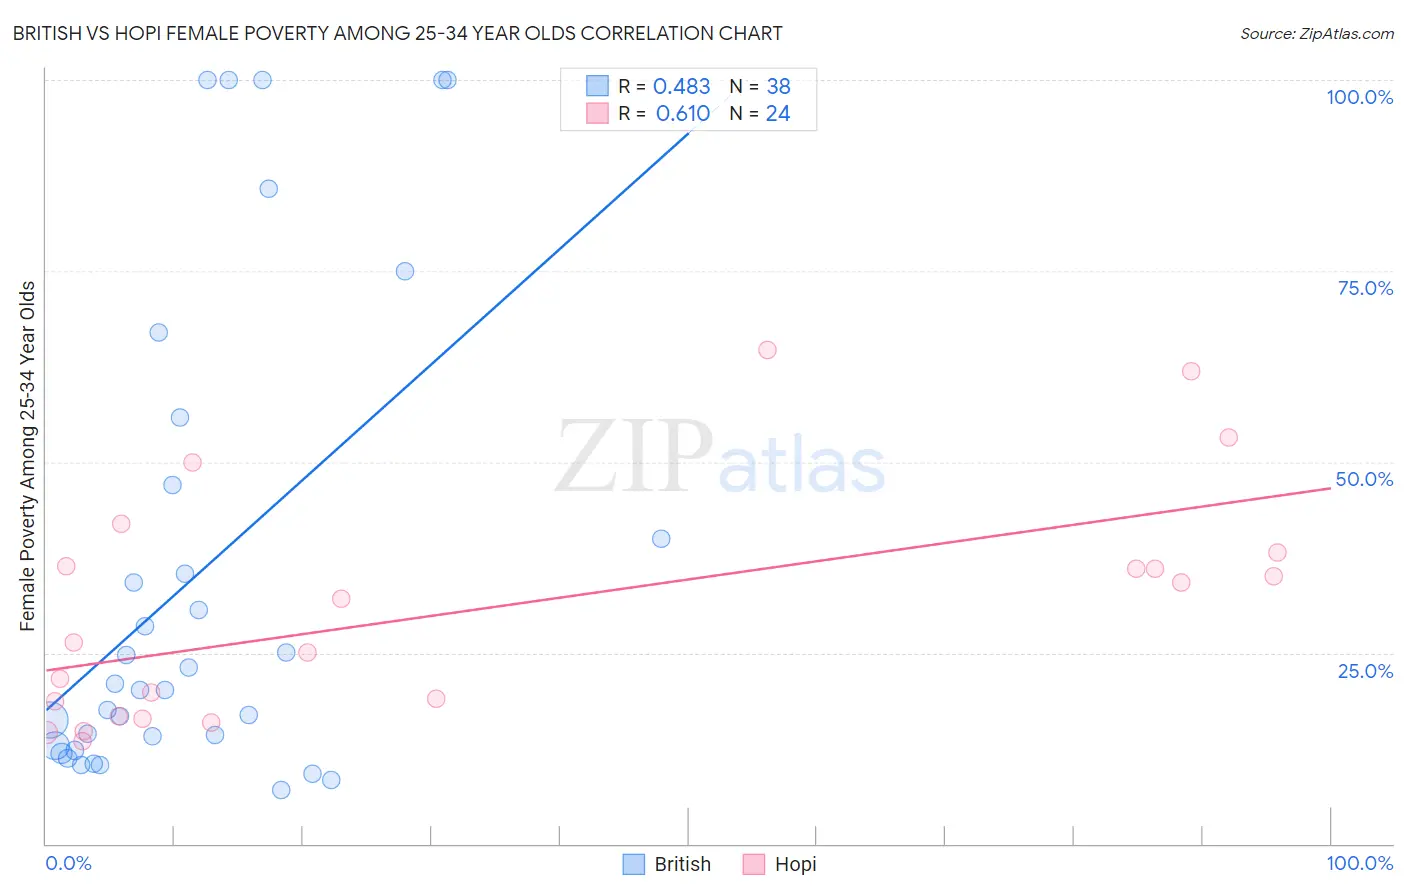
British vs Hopi Female Poverty Among 25-34 Year Olds Correlation Chart
The statistical analysis conducted on geographies consisting of 515,268,624 people shows a moderate positive correlation between the proportion of British and poverty level among females between the ages 25 and 34 in the United States with a correlation coefficient (R) of 0.483 and weighted average of 13.4%. Similarly, the statistical analysis conducted on geographies consisting of 74,551,308 people shows a significant positive correlation between the proportion of Hopi and poverty level among females between the ages 25 and 34 in the United States with a correlation coefficient (R) of 0.610 and weighted average of 23.7%, a difference of 77.0%.
Female Poverty Among 25-34 Year Olds Correlation Summary
| Measurement | British | Hopi |
| Minimum | 7.0% | 13.5% |
| Maximum | 100.0% | 64.6% |
| Range | 93.0% | 51.1% |
| Mean | 35.4% | 30.9% |
| Median | 20.6% | 29.1% |
| Interquartile 25% (IQ1) | 12.8% | 17.6% |
| Interquartile 75% (IQ3) | 46.9% | 37.3% |
| Interquartile Range (IQR) | 34.1% | 19.6% |
| Standard Deviation (Sample) | 31.5% | 15.1% |
| Standard Deviation (Population) | 31.1% | 14.8% |
Similar Demographics by Female Poverty Among 25-34 Year Olds
Demographics Similar to British by Female Poverty Among 25-34 Year Olds
In terms of female poverty among 25-34 year olds, the demographic groups most similar to British are Ugandan (13.4%, a difference of 0.050%), Swiss (13.4%, a difference of 0.16%), Icelander (13.3%, a difference of 0.20%), Immigrants from South America (13.3%, a difference of 0.26%), and Uruguayan (13.3%, a difference of 0.32%).
| Demographics | Rating | Rank | Female Poverty Among 25-34 Year Olds |
| Immigrants | Cameroon | 72.0 /100 | #156 | Good 13.3% |
| Immigrants | Western Europe | 70.3 /100 | #157 | Good 13.3% |
| Immigrants | Colombia | 69.2 /100 | #158 | Good 13.3% |
| Uruguayans | 66.9 /100 | #159 | Good 13.3% |
| Immigrants | South America | 66.3 /100 | #160 | Good 13.3% |
| Icelanders | 65.7 /100 | #161 | Good 13.3% |
| Ugandans | 64.1 /100 | #162 | Good 13.4% |
| British | 63.5 /100 | #163 | Good 13.4% |
| Swiss | 61.7 /100 | #164 | Good 13.4% |
| Basques | 59.3 /100 | #165 | Average 13.4% |
| Belgians | 58.9 /100 | #166 | Average 13.4% |
| Immigrants | Bosnia and Herzegovina | 58.6 /100 | #167 | Average 13.4% |
| Immigrants | Afghanistan | 57.7 /100 | #168 | Average 13.4% |
| Samoans | 56.8 /100 | #169 | Average 13.5% |
| Immigrants | Uganda | 53.0 /100 | #170 | Average 13.5% |
Demographics Similar to Hopi by Female Poverty Among 25-34 Year Olds
In terms of female poverty among 25-34 year olds, the demographic groups most similar to Hopi are Navajo (23.3%, a difference of 1.4%), Yup'ik (24.3%, a difference of 2.7%), Sioux (23.0%, a difference of 3.1%), Yuman (22.9%, a difference of 3.3%), and Houma (22.7%, a difference of 4.2%).
| Demographics | Rating | Rank | Female Poverty Among 25-34 Year Olds |
| Cajuns | 0.0 /100 | #333 | Tragic 19.9% |
| Apache | 0.0 /100 | #334 | Tragic 20.1% |
| Natives/Alaskans | 0.0 /100 | #335 | Tragic 20.3% |
| Pueblo | 0.0 /100 | #336 | Tragic 22.2% |
| Crow | 0.0 /100 | #337 | Tragic 22.7% |
| Houma | 0.0 /100 | #338 | Tragic 22.7% |
| Yuman | 0.0 /100 | #339 | Tragic 22.9% |
| Sioux | 0.0 /100 | #340 | Tragic 23.0% |
| Navajo | 0.0 /100 | #341 | Tragic 23.3% |
| Hopi | 0.0 /100 | #342 | Tragic 23.7% |
| Yup'ik | 0.0 /100 | #343 | Tragic 24.3% |
| Tohono O'odham | 0.0 /100 | #344 | Tragic 24.7% |
| Pima | 0.0 /100 | #345 | Tragic 25.3% |
| Lumbee | 0.0 /100 | #346 | Tragic 26.3% |
| Puerto Ricans | 0.0 /100 | #347 | Tragic 26.3% |