Brazilian vs Mongolian Female Poverty
COMPARE
Brazilian
Mongolian
Female Poverty
Female Poverty Comparison
Brazilians
Mongolians
13.0%
FEMALE POVERTY
80.5/ 100
METRIC RATING
142nd/ 347
METRIC RANK
13.4%
FEMALE POVERTY
53.6/ 100
METRIC RATING
172nd/ 347
METRIC RANK
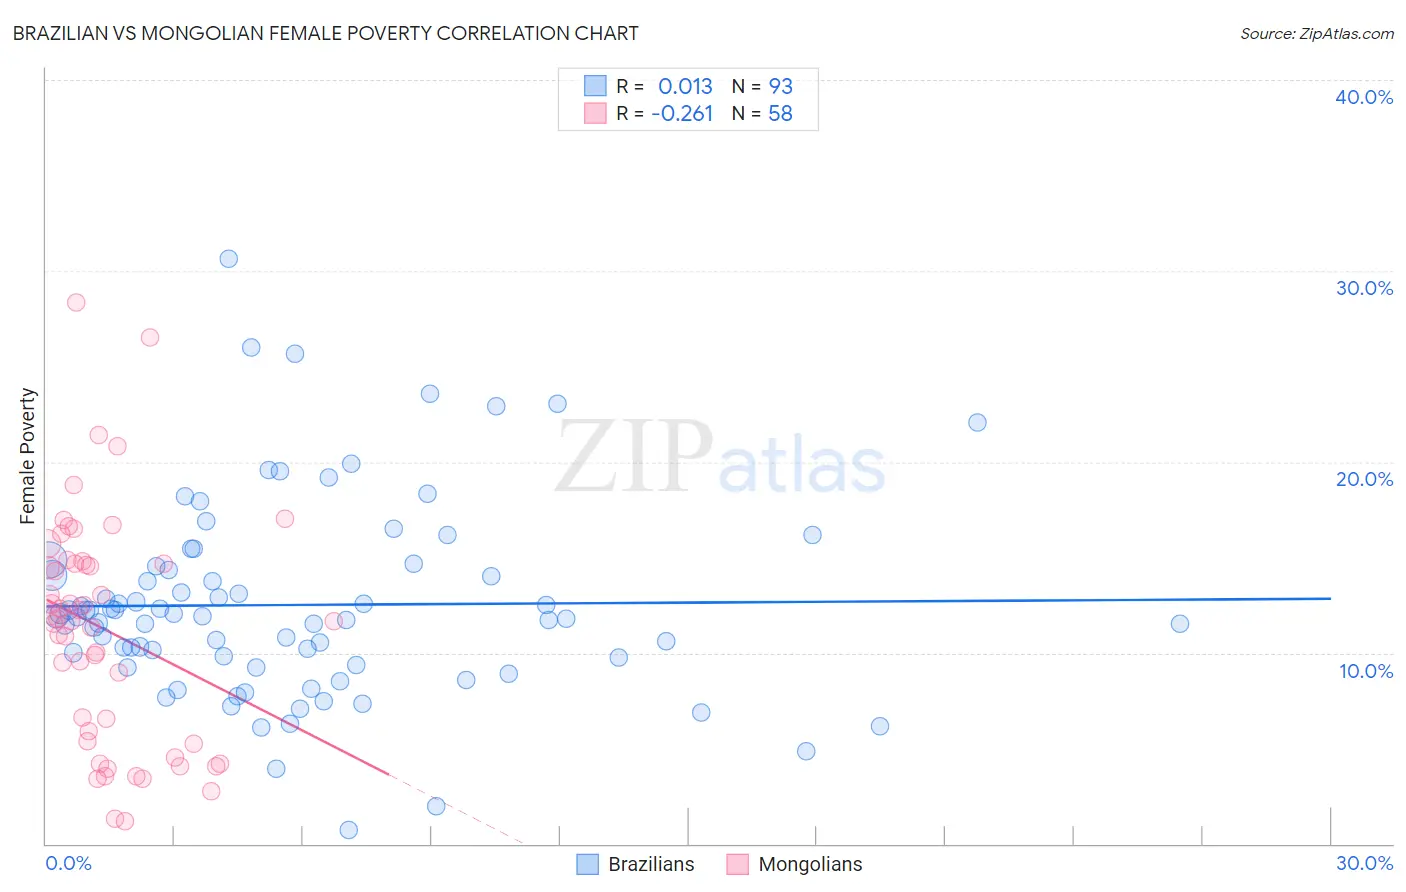
Brazilian vs Mongolian Female Poverty Correlation Chart
The statistical analysis conducted on geographies consisting of 323,667,111 people shows no correlation between the proportion of Brazilians and poverty level among females in the United States with a correlation coefficient (R) of 0.013 and weighted average of 13.0%. Similarly, the statistical analysis conducted on geographies consisting of 140,282,925 people shows a weak negative correlation between the proportion of Mongolians and poverty level among females in the United States with a correlation coefficient (R) of -0.261 and weighted average of 13.4%, a difference of 3.2%.
Female Poverty Correlation Summary
| Measurement | Brazilian | Mongolian |
| Minimum | 0.74% | 1.2% |
| Maximum | 30.6% | 28.4% |
| Range | 29.9% | 27.2% |
| Mean | 12.5% | 11.2% |
| Median | 11.9% | 11.7% |
| Interquartile 25% (IQ1) | 9.6% | 5.3% |
| Interquartile 75% (IQ3) | 14.4% | 14.7% |
| Interquartile Range (IQR) | 4.9% | 9.4% |
| Standard Deviation (Sample) | 5.1% | 6.0% |
| Standard Deviation (Population) | 5.1% | 5.9% |
Similar Demographics by Female Poverty
Demographics Similar to Brazilians by Female Poverty
In terms of female poverty, the demographic groups most similar to Brazilians are Immigrants from Malaysia (13.0%, a difference of 0.020%), Icelander (13.0%, a difference of 0.10%), Afghan (13.0%, a difference of 0.11%), Syrian (13.0%, a difference of 0.14%), and Immigrants from Peru (13.0%, a difference of 0.22%).
| Demographics | Rating | Rank | Female Poverty |
| French | 85.6 /100 | #135 | Excellent 12.9% |
| Peruvians | 85.2 /100 | #136 | Excellent 12.9% |
| Chileans | 84.7 /100 | #137 | Excellent 12.9% |
| Immigrants | France | 83.6 /100 | #138 | Excellent 12.9% |
| Basques | 83.1 /100 | #139 | Excellent 12.9% |
| Pakistanis | 83.0 /100 | #140 | Excellent 12.9% |
| Icelanders | 81.1 /100 | #141 | Excellent 13.0% |
| Brazilians | 80.5 /100 | #142 | Excellent 13.0% |
| Immigrants | Malaysia | 80.4 /100 | #143 | Excellent 13.0% |
| Afghans | 79.8 /100 | #144 | Good 13.0% |
| Syrians | 79.6 /100 | #145 | Good 13.0% |
| Immigrants | Peru | 79.1 /100 | #146 | Good 13.0% |
| Immigrants | Kazakhstan | 78.6 /100 | #147 | Good 13.0% |
| Yugoslavians | 76.9 /100 | #148 | Good 13.1% |
| Taiwanese | 75.7 /100 | #149 | Good 13.1% |
Demographics Similar to Mongolians by Female Poverty
In terms of female poverty, the demographic groups most similar to Mongolians are White/Caucasian (13.4%, a difference of 0.10%), Colombian (13.4%, a difference of 0.21%), Lebanese (13.4%, a difference of 0.23%), Immigrants from Afghanistan (13.4%, a difference of 0.27%), and Aleut (13.4%, a difference of 0.31%).
| Demographics | Rating | Rank | Female Poverty |
| Scotch-Irish | 62.1 /100 | #165 | Good 13.3% |
| Immigrants | Oceania | 59.7 /100 | #166 | Average 13.3% |
| Immigrants | Chile | 57.4 /100 | #167 | Average 13.3% |
| Aleuts | 56.7 /100 | #168 | Average 13.4% |
| Lebanese | 55.9 /100 | #169 | Average 13.4% |
| Colombians | 55.7 /100 | #170 | Average 13.4% |
| Whites/Caucasians | 54.6 /100 | #171 | Average 13.4% |
| Mongolians | 53.6 /100 | #172 | Average 13.4% |
| Immigrants | Afghanistan | 50.8 /100 | #173 | Average 13.4% |
| Immigrants | Iraq | 50.0 /100 | #174 | Average 13.4% |
| Celtics | 49.9 /100 | #175 | Average 13.4% |
| Immigrants | Spain | 49.9 /100 | #176 | Average 13.4% |
| Immigrants | Morocco | 49.4 /100 | #177 | Average 13.4% |
| Israelis | 49.1 /100 | #178 | Average 13.5% |
| Immigrants | Syria | 48.8 /100 | #179 | Average 13.5% |