Brazilian vs French Canadian Female Poverty
COMPARE
Brazilian
French Canadian
Female Poverty
Female Poverty Comparison
Brazilians
French Canadians
13.0%
FEMALE POVERTY
80.5/ 100
METRIC RATING
142nd/ 347
METRIC RANK
12.7%
FEMALE POVERTY
90.2/ 100
METRIC RATING
122nd/ 347
METRIC RANK
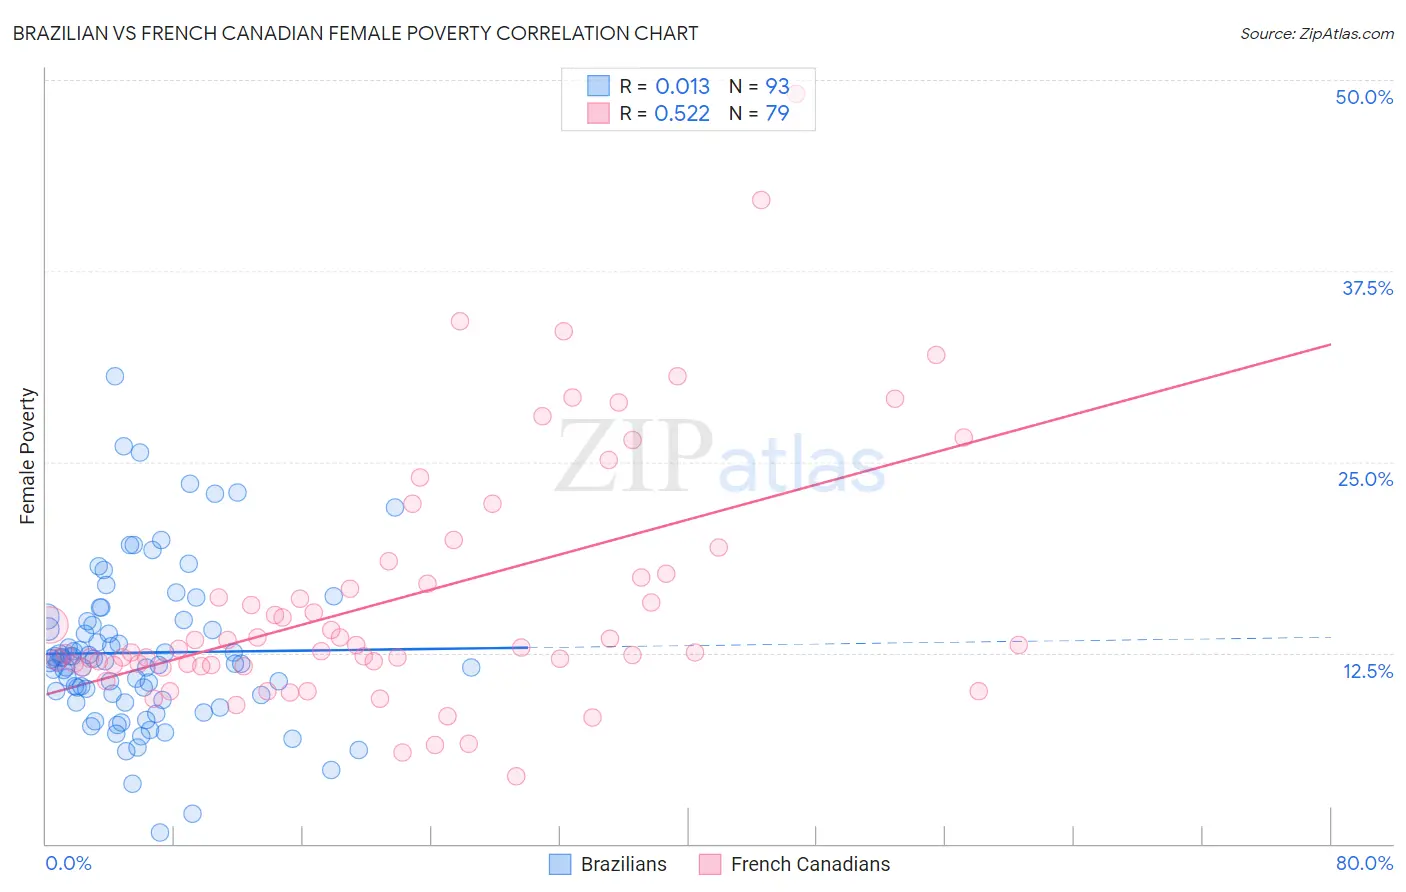
Brazilian vs French Canadian Female Poverty Correlation Chart
The statistical analysis conducted on geographies consisting of 323,667,111 people shows no correlation between the proportion of Brazilians and poverty level among females in the United States with a correlation coefficient (R) of 0.013 and weighted average of 13.0%. Similarly, the statistical analysis conducted on geographies consisting of 502,012,927 people shows a substantial positive correlation between the proportion of French Canadians and poverty level among females in the United States with a correlation coefficient (R) of 0.522 and weighted average of 12.7%, a difference of 2.0%.
Female Poverty Correlation Summary
| Measurement | Brazilian | French Canadian |
| Minimum | 0.74% | 4.4% |
| Maximum | 30.6% | 49.1% |
| Range | 29.9% | 44.7% |
| Mean | 12.5% | 16.1% |
| Median | 11.9% | 12.8% |
| Interquartile 25% (IQ1) | 9.6% | 11.7% |
| Interquartile 75% (IQ3) | 14.4% | 17.6% |
| Interquartile Range (IQR) | 4.9% | 6.0% |
| Standard Deviation (Sample) | 5.1% | 8.3% |
| Standard Deviation (Population) | 5.1% | 8.2% |
Demographics Similar to Brazilians and French Canadians by Female Poverty
In terms of female poverty, the demographic groups most similar to Brazilians are Icelander (13.0%, a difference of 0.10%), Pakistani (12.9%, a difference of 0.42%), Basque (12.9%, a difference of 0.43%), Immigrants from France (12.9%, a difference of 0.52%), and Chilean (12.9%, a difference of 0.74%). Similarly, the demographic groups most similar to French Canadians are Immigrants from South Eastern Asia (12.7%, a difference of 0.070%), Immigrants from Norway (12.8%, a difference of 0.24%), Argentinean (12.8%, a difference of 0.29%), Immigrants from Ukraine (12.8%, a difference of 0.37%), and South African (12.8%, a difference of 0.47%).
| Demographics | Rating | Rank | Female Poverty |
| French Canadians | 90.2 /100 | #122 | Exceptional 12.7% |
| Immigrants | South Eastern Asia | 89.9 /100 | #123 | Excellent 12.7% |
| Immigrants | Norway | 89.3 /100 | #124 | Excellent 12.8% |
| Argentineans | 89.1 /100 | #125 | Excellent 12.8% |
| Immigrants | Ukraine | 88.8 /100 | #126 | Excellent 12.8% |
| South Africans | 88.4 /100 | #127 | Excellent 12.8% |
| Immigrants | Belarus | 88.2 /100 | #128 | Excellent 12.8% |
| Immigrants | Brazil | 87.9 /100 | #129 | Excellent 12.8% |
| Immigrants | Vietnam | 87.1 /100 | #130 | Excellent 12.8% |
| Immigrants | Argentina | 87.0 /100 | #131 | Excellent 12.8% |
| Immigrants | Jordan | 86.9 /100 | #132 | Excellent 12.8% |
| Immigrants | Western Europe | 86.6 /100 | #133 | Excellent 12.8% |
| Immigrants | Switzerland | 85.8 /100 | #134 | Excellent 12.9% |
| French | 85.6 /100 | #135 | Excellent 12.9% |
| Peruvians | 85.2 /100 | #136 | Excellent 12.9% |
| Chileans | 84.7 /100 | #137 | Excellent 12.9% |
| Immigrants | France | 83.6 /100 | #138 | Excellent 12.9% |
| Basques | 83.1 /100 | #139 | Excellent 12.9% |
| Pakistanis | 83.0 /100 | #140 | Excellent 12.9% |
| Icelanders | 81.1 /100 | #141 | Excellent 13.0% |
| Brazilians | 80.5 /100 | #142 | Excellent 13.0% |