Brazilian vs Mongolian Average Family Size
COMPARE
Brazilian
Mongolian
Average Family Size
Average Family Size Comparison
Brazilians
Mongolians
3.18
AVERAGE FAMILY SIZE
4.5/ 100
METRIC RATING
233rd/ 347
METRIC RANK
3.20
AVERAGE FAMILY SIZE
11.5/ 100
METRIC RATING
213th/ 347
METRIC RANK
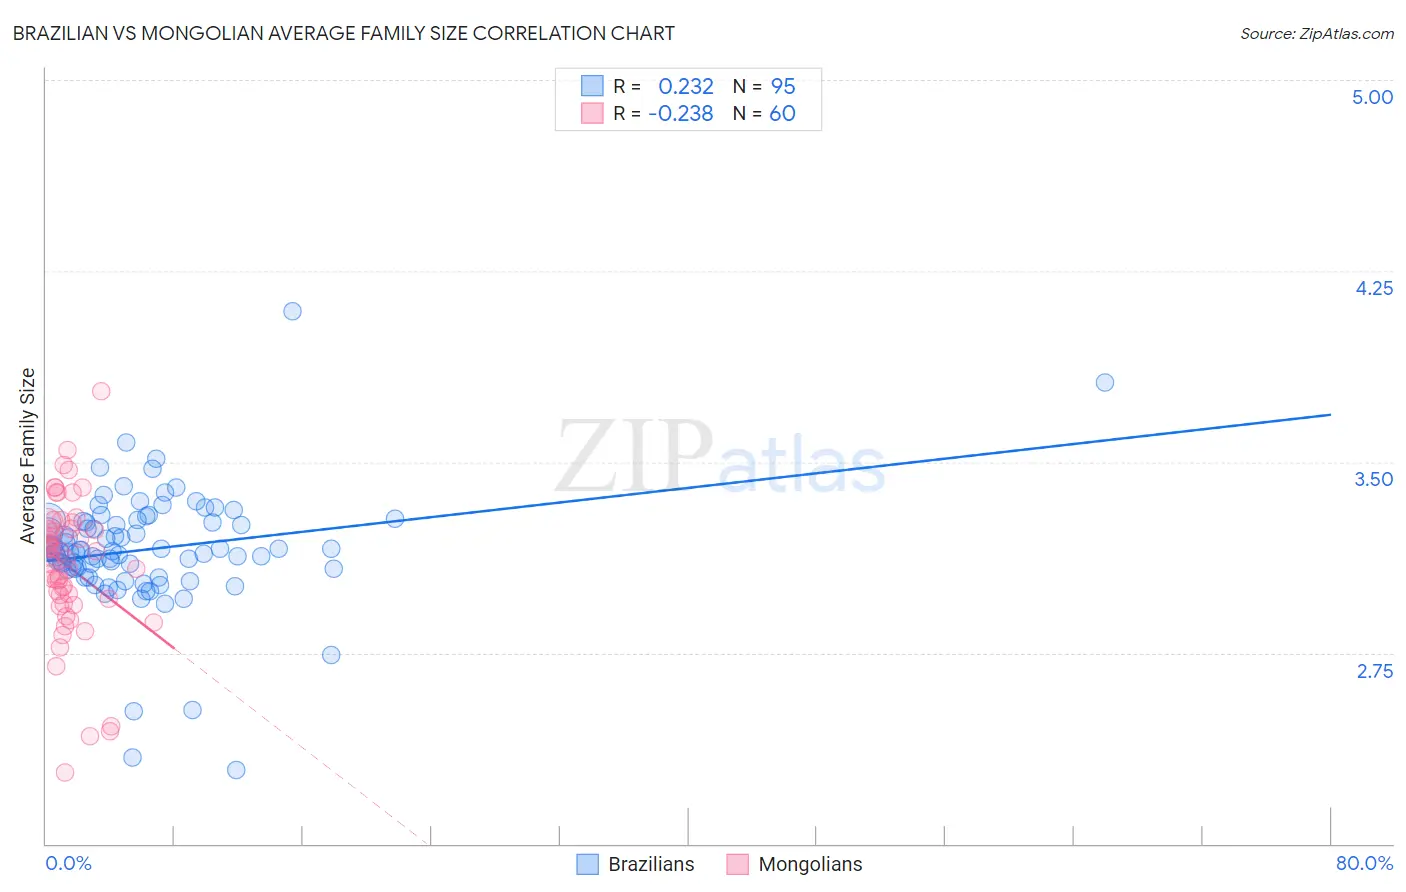
Brazilian vs Mongolian Average Family Size Correlation Chart
The statistical analysis conducted on geographies consisting of 323,732,012 people shows a weak positive correlation between the proportion of Brazilians and average family size in the United States with a correlation coefficient (R) of 0.232 and weighted average of 3.18. Similarly, the statistical analysis conducted on geographies consisting of 140,294,532 people shows a weak negative correlation between the proportion of Mongolians and average family size in the United States with a correlation coefficient (R) of -0.238 and weighted average of 3.20, a difference of 0.47%.
Average Family Size Correlation Summary
| Measurement | Brazilian | Mongolian |
| Minimum | 2.29 | 2.28 |
| Maximum | 4.09 | 3.78 |
| Range | 1.80 | 1.50 |
| Mean | 3.16 | 3.09 |
| Median | 3.15 | 3.12 |
| Interquartile 25% (IQ1) | 3.08 | 2.95 |
| Interquartile 75% (IQ3) | 3.26 | 3.25 |
| Interquartile Range (IQR) | 0.19 | 0.30 |
| Standard Deviation (Sample) | 0.24 | 0.28 |
| Standard Deviation (Population) | 0.24 | 0.27 |
Demographics Similar to Brazilians and Mongolians by Average Family Size
In terms of average family size, the demographic groups most similar to Brazilians are Cherokee (3.18, a difference of 0.020%), Icelander (3.19, a difference of 0.070%), Basque (3.19, a difference of 0.070%), Immigrants from Italy (3.19, a difference of 0.080%), and Nonimmigrants (3.19, a difference of 0.12%). Similarly, the demographic groups most similar to Mongolians are Somali (3.20, a difference of 0.020%), Delaware (3.20, a difference of 0.020%), Bermudan (3.20, a difference of 0.030%), Immigrants from Somalia (3.20, a difference of 0.060%), and French American Indian (3.20, a difference of 0.090%).
| Demographics | Rating | Rank | Average Family Size |
| Mongolians | 11.5 /100 | #213 | Poor 3.20 |
| Somalis | 11.2 /100 | #214 | Poor 3.20 |
| Delaware | 11.1 /100 | #215 | Poor 3.20 |
| Bermudans | 11.0 /100 | #216 | Poor 3.20 |
| Immigrants | Somalia | 10.3 /100 | #217 | Poor 3.20 |
| French American Indians | 9.8 /100 | #218 | Tragic 3.20 |
| Pennsylvania Germans | 9.3 /100 | #219 | Tragic 3.19 |
| Lebanese | 9.1 /100 | #220 | Tragic 3.19 |
| Immigrants | Ukraine | 7.2 /100 | #221 | Tragic 3.19 |
| Immigrants | Kuwait | 7.2 /100 | #222 | Tragic 3.19 |
| Immigrants | Zimbabwe | 7.1 /100 | #223 | Tragic 3.19 |
| Syrians | 6.5 /100 | #224 | Tragic 3.19 |
| Cree | 6.2 /100 | #225 | Tragic 3.19 |
| Chickasaw | 6.0 /100 | #226 | Tragic 3.19 |
| Portuguese | 6.0 /100 | #227 | Tragic 3.19 |
| Immigrants | Nonimmigrants | 5.7 /100 | #228 | Tragic 3.19 |
| Immigrants | Italy | 5.3 /100 | #229 | Tragic 3.19 |
| Icelanders | 5.2 /100 | #230 | Tragic 3.19 |
| Basques | 5.2 /100 | #231 | Tragic 3.19 |
| Cherokee | 4.7 /100 | #232 | Tragic 3.18 |
| Brazilians | 4.5 /100 | #233 | Tragic 3.18 |