Immigrants from Zaire vs Mongolian Female Poverty
COMPARE
Immigrants from Zaire
Mongolian
Female Poverty
Female Poverty Comparison
Immigrants from Zaire
Mongolians
16.4%
FEMALE POVERTY
0.0/ 100
METRIC RATING
292nd/ 347
METRIC RANK
13.4%
FEMALE POVERTY
53.6/ 100
METRIC RATING
172nd/ 347
METRIC RANK
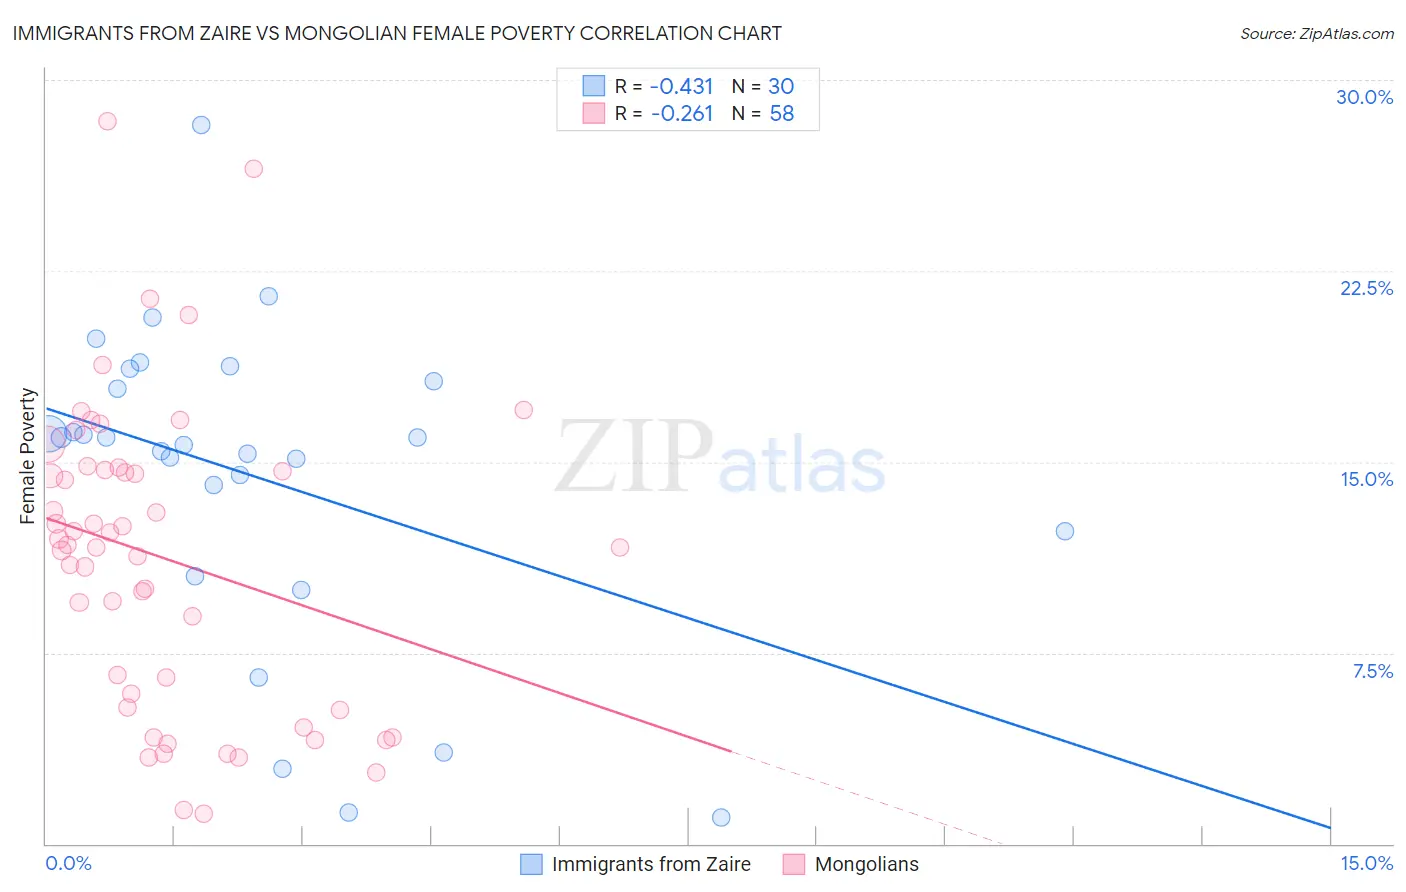
Immigrants from Zaire vs Mongolian Female Poverty Correlation Chart
The statistical analysis conducted on geographies consisting of 107,241,785 people shows a moderate negative correlation between the proportion of Immigrants from Zaire and poverty level among females in the United States with a correlation coefficient (R) of -0.431 and weighted average of 16.4%. Similarly, the statistical analysis conducted on geographies consisting of 140,282,925 people shows a weak negative correlation between the proportion of Mongolians and poverty level among females in the United States with a correlation coefficient (R) of -0.261 and weighted average of 13.4%, a difference of 22.6%.
Female Poverty Correlation Summary
| Measurement | Immigrants from Zaire | Mongolian |
| Minimum | 1.0% | 1.2% |
| Maximum | 28.2% | 28.4% |
| Range | 27.2% | 27.2% |
| Mean | 14.4% | 11.2% |
| Median | 15.8% | 11.7% |
| Interquartile 25% (IQ1) | 12.3% | 5.3% |
| Interquartile 75% (IQ3) | 18.2% | 14.7% |
| Interquartile Range (IQR) | 5.9% | 9.4% |
| Standard Deviation (Sample) | 6.2% | 6.0% |
| Standard Deviation (Population) | 6.1% | 5.9% |
Similar Demographics by Female Poverty
Demographics Similar to Immigrants from Zaire by Female Poverty
In terms of female poverty, the demographic groups most similar to Immigrants from Zaire are Yaqui (16.4%, a difference of 0.010%), Immigrants from Latin America (16.4%, a difference of 0.060%), Immigrants from Cabo Verde (16.4%, a difference of 0.090%), Senegalese (16.5%, a difference of 0.17%), and Immigrants from Bangladesh (16.4%, a difference of 0.18%).
| Demographics | Rating | Rank | Female Poverty |
| Comanche | 0.0 /100 | #285 | Tragic 16.2% |
| Inupiat | 0.0 /100 | #286 | Tragic 16.2% |
| Immigrants | Belize | 0.0 /100 | #287 | Tragic 16.3% |
| Indonesians | 0.0 /100 | #288 | Tragic 16.4% |
| Blackfeet | 0.0 /100 | #289 | Tragic 16.4% |
| Immigrants | Bangladesh | 0.0 /100 | #290 | Tragic 16.4% |
| Yaqui | 0.0 /100 | #291 | Tragic 16.4% |
| Immigrants | Zaire | 0.0 /100 | #292 | Tragic 16.4% |
| Immigrants | Latin America | 0.0 /100 | #293 | Tragic 16.4% |
| Immigrants | Cabo Verde | 0.0 /100 | #294 | Tragic 16.4% |
| Senegalese | 0.0 /100 | #295 | Tragic 16.5% |
| Immigrants | Senegal | 0.0 /100 | #296 | Tragic 16.5% |
| Mexicans | 0.0 /100 | #297 | Tragic 16.5% |
| Somalis | 0.0 /100 | #298 | Tragic 16.6% |
| Hispanics or Latinos | 0.0 /100 | #299 | Tragic 16.6% |
Demographics Similar to Mongolians by Female Poverty
In terms of female poverty, the demographic groups most similar to Mongolians are White/Caucasian (13.4%, a difference of 0.10%), Colombian (13.4%, a difference of 0.21%), Lebanese (13.4%, a difference of 0.23%), Immigrants from Afghanistan (13.4%, a difference of 0.27%), and Aleut (13.4%, a difference of 0.31%).
| Demographics | Rating | Rank | Female Poverty |
| Scotch-Irish | 62.1 /100 | #165 | Good 13.3% |
| Immigrants | Oceania | 59.7 /100 | #166 | Average 13.3% |
| Immigrants | Chile | 57.4 /100 | #167 | Average 13.3% |
| Aleuts | 56.7 /100 | #168 | Average 13.4% |
| Lebanese | 55.9 /100 | #169 | Average 13.4% |
| Colombians | 55.7 /100 | #170 | Average 13.4% |
| Whites/Caucasians | 54.6 /100 | #171 | Average 13.4% |
| Mongolians | 53.6 /100 | #172 | Average 13.4% |
| Immigrants | Afghanistan | 50.8 /100 | #173 | Average 13.4% |
| Immigrants | Iraq | 50.0 /100 | #174 | Average 13.4% |
| Celtics | 49.9 /100 | #175 | Average 13.4% |
| Immigrants | Spain | 49.9 /100 | #176 | Average 13.4% |
| Immigrants | Morocco | 49.4 /100 | #177 | Average 13.4% |
| Israelis | 49.1 /100 | #178 | Average 13.5% |
| Immigrants | Syria | 48.8 /100 | #179 | Average 13.5% |