Brazilian vs Immigrants from Uruguay Cognitive Disability
COMPARE
Brazilian
Immigrants from Uruguay
Cognitive Disability
Cognitive Disability Comparison
Brazilians
Immigrants from Uruguay
17.1%
COGNITIVE DISABILITY
78.9/ 100
METRIC RATING
155th/ 347
METRIC RANK
17.0%
COGNITIVE DISABILITY
92.9/ 100
METRIC RATING
129th/ 347
METRIC RANK
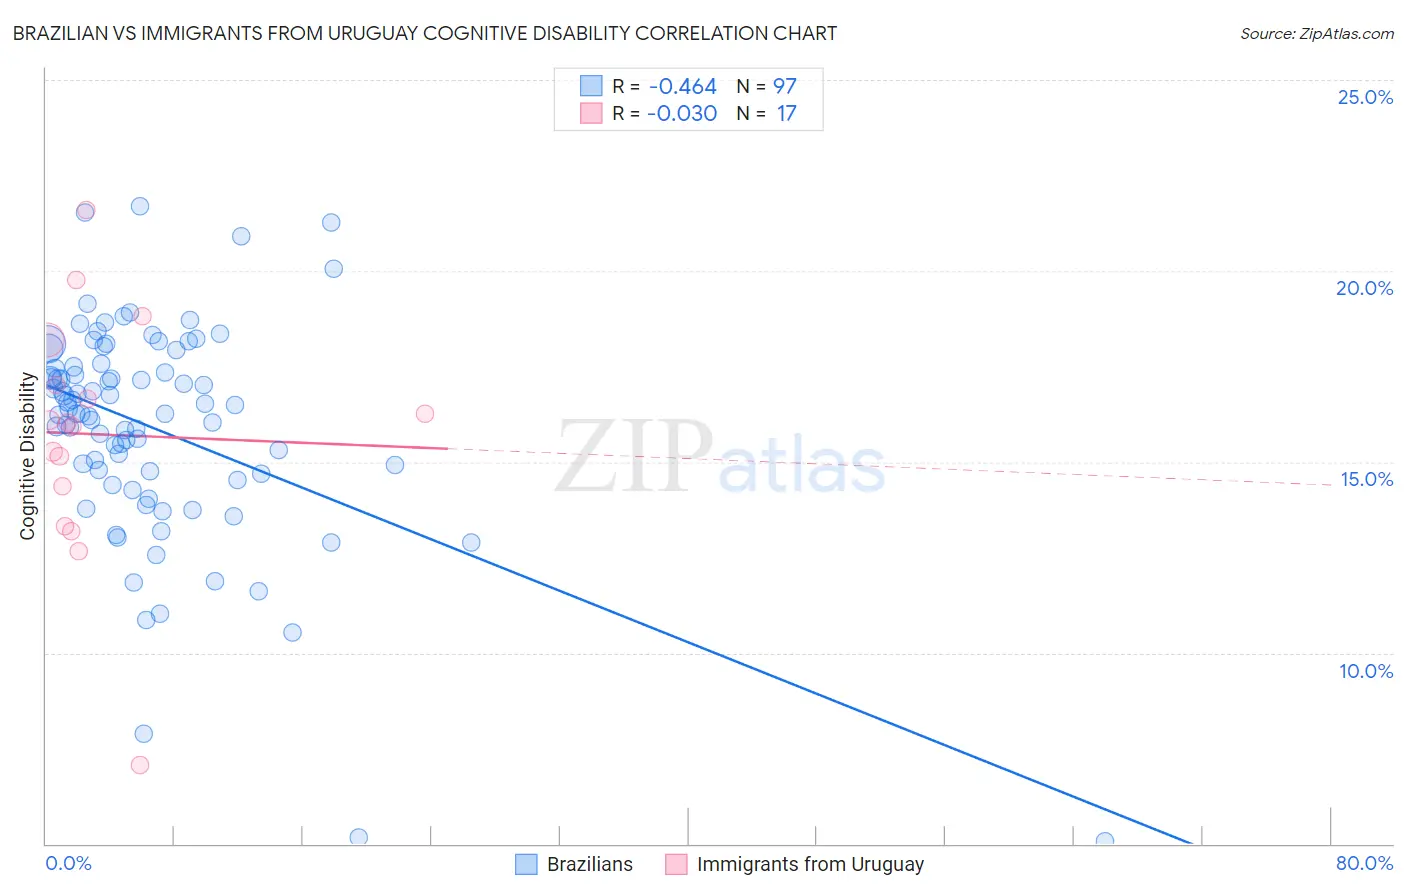
Brazilian vs Immigrants from Uruguay Cognitive Disability Correlation Chart
The statistical analysis conducted on geographies consisting of 323,952,153 people shows a moderate negative correlation between the proportion of Brazilians and percentage of population with cognitive disability in the United States with a correlation coefficient (R) of -0.464 and weighted average of 17.1%. Similarly, the statistical analysis conducted on geographies consisting of 133,256,548 people shows no correlation between the proportion of Immigrants from Uruguay and percentage of population with cognitive disability in the United States with a correlation coefficient (R) of -0.030 and weighted average of 17.0%, a difference of 0.91%.
Cognitive Disability Correlation Summary
| Measurement | Brazilian | Immigrants from Uruguay |
| Minimum | 5.1% | 7.0% |
| Maximum | 21.7% | 21.6% |
| Range | 16.6% | 14.5% |
| Mean | 15.9% | 15.7% |
| Median | 16.3% | 16.0% |
| Interquartile 25% (IQ1) | 14.6% | 13.8% |
| Interquartile 75% (IQ3) | 17.5% | 17.6% |
| Interquartile Range (IQR) | 2.9% | 3.8% |
| Standard Deviation (Sample) | 2.9% | 3.2% |
| Standard Deviation (Population) | 2.9% | 3.2% |
Similar Demographics by Cognitive Disability
Demographics Similar to Brazilians by Cognitive Disability
In terms of cognitive disability, the demographic groups most similar to Brazilians are Sri Lankan (17.1%, a difference of 0.0%), Immigrants from Malaysia (17.1%, a difference of 0.020%), Immigrants from Kazakhstan (17.1%, a difference of 0.070%), Immigrants from Australia (17.1%, a difference of 0.12%), and Immigrants from Indonesia (17.1%, a difference of 0.17%).
| Demographics | Rating | Rank | Cognitive Disability |
| French Canadians | 85.7 /100 | #148 | Excellent 17.1% |
| Cypriots | 85.7 /100 | #149 | Excellent 17.1% |
| Basques | 85.5 /100 | #150 | Excellent 17.1% |
| Syrians | 83.0 /100 | #151 | Excellent 17.1% |
| Immigrants | Indonesia | 82.7 /100 | #152 | Excellent 17.1% |
| Immigrants | Kazakhstan | 80.5 /100 | #153 | Excellent 17.1% |
| Immigrants | Malaysia | 79.3 /100 | #154 | Good 17.1% |
| Brazilians | 78.9 /100 | #155 | Good 17.1% |
| Sri Lankans | 78.9 /100 | #156 | Good 17.1% |
| Immigrants | Australia | 76.0 /100 | #157 | Good 17.1% |
| Celtics | 74.1 /100 | #158 | Good 17.1% |
| Immigrants | Latvia | 73.2 /100 | #159 | Good 17.2% |
| Australians | 72.4 /100 | #160 | Good 17.2% |
| Americans | 72.2 /100 | #161 | Good 17.2% |
| Yugoslavians | 71.6 /100 | #162 | Good 17.2% |
Demographics Similar to Immigrants from Uruguay by Cognitive Disability
In terms of cognitive disability, the demographic groups most similar to Immigrants from Uruguay are Nicaraguan (17.0%, a difference of 0.010%), Immigrants from Costa Rica (17.0%, a difference of 0.020%), European (17.0%, a difference of 0.060%), Immigrants from Vietnam (17.0%, a difference of 0.060%), and Immigrants from Germany (17.0%, a difference of 0.080%).
| Demographics | Rating | Rank | Cognitive Disability |
| Immigrants | Western Europe | 94.8 /100 | #122 | Exceptional 16.9% |
| Portuguese | 94.7 /100 | #123 | Exceptional 16.9% |
| Turks | 94.5 /100 | #124 | Exceptional 16.9% |
| Scandinavians | 94.1 /100 | #125 | Exceptional 16.9% |
| Europeans | 93.4 /100 | #126 | Exceptional 17.0% |
| Immigrants | Costa Rica | 93.1 /100 | #127 | Exceptional 17.0% |
| Nicaraguans | 93.0 /100 | #128 | Exceptional 17.0% |
| Immigrants | Uruguay | 92.9 /100 | #129 | Exceptional 17.0% |
| Immigrants | Vietnam | 92.4 /100 | #130 | Exceptional 17.0% |
| Immigrants | Germany | 92.1 /100 | #131 | Exceptional 17.0% |
| Whites/Caucasians | 92.1 /100 | #132 | Exceptional 17.0% |
| Immigrants | Jordan | 91.9 /100 | #133 | Exceptional 17.0% |
| Immigrants | Chile | 91.7 /100 | #134 | Exceptional 17.0% |
| Lebanese | 91.3 /100 | #135 | Exceptional 17.0% |
| Israelis | 91.0 /100 | #136 | Exceptional 17.0% |