Bolivian vs Soviet Union Associate's Degree
COMPARE
Bolivian
Soviet Union
Associate's Degree
Associate's Degree Comparison
Bolivians
Soviet Union
52.0%
ASSOCIATE'S DEGREE
99.8/ 100
METRIC RATING
52nd/ 347
METRIC RANK
55.1%
ASSOCIATE'S DEGREE
100.0/ 100
METRIC RATING
16th/ 347
METRIC RANK
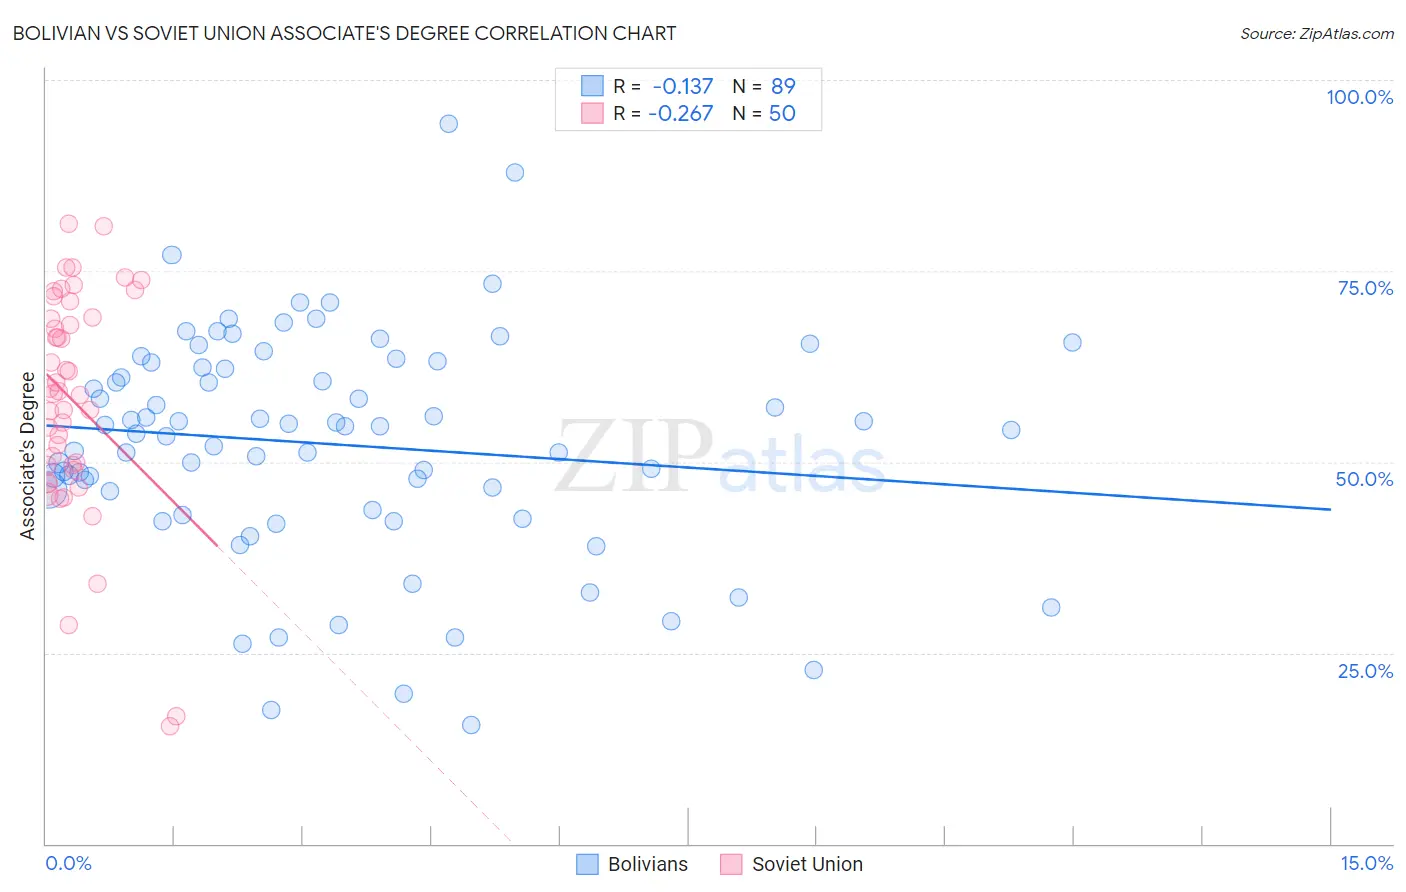
Bolivian vs Soviet Union Associate's Degree Correlation Chart
The statistical analysis conducted on geographies consisting of 184,667,780 people shows a poor negative correlation between the proportion of Bolivians and percentage of population with at least associate's degree education in the United States with a correlation coefficient (R) of -0.137 and weighted average of 52.0%. Similarly, the statistical analysis conducted on geographies consisting of 43,514,626 people shows a weak negative correlation between the proportion of Soviet Union and percentage of population with at least associate's degree education in the United States with a correlation coefficient (R) of -0.267 and weighted average of 55.1%, a difference of 6.0%.
Associate's Degree Correlation Summary
| Measurement | Bolivian | Soviet Union |
| Minimum | 15.5% | 15.5% |
| Maximum | 94.2% | 81.2% |
| Range | 78.7% | 65.7% |
| Mean | 52.3% | 58.0% |
| Median | 54.2% | 59.1% |
| Interquartile 25% (IQ1) | 45.0% | 49.5% |
| Interquartile 75% (IQ3) | 62.7% | 68.9% |
| Interquartile Range (IQR) | 17.7% | 19.4% |
| Standard Deviation (Sample) | 14.7% | 14.7% |
| Standard Deviation (Population) | 14.6% | 14.5% |
Similar Demographics by Associate's Degree
Demographics Similar to Bolivians by Associate's Degree
In terms of associate's degree, the demographic groups most similar to Bolivians are Immigrants from Asia (52.0%, a difference of 0.020%), Immigrants from Spain (51.9%, a difference of 0.13%), Australian (51.9%, a difference of 0.16%), Immigrants from Czechoslovakia (51.9%, a difference of 0.17%), and Immigrants from Greece (52.1%, a difference of 0.21%).
| Demographics | Rating | Rank | Associate's Degree |
| Immigrants | Lithuania | 99.9 /100 | #45 | Exceptional 52.4% |
| Immigrants | Bulgaria | 99.9 /100 | #46 | Exceptional 52.4% |
| Immigrants | Kuwait | 99.9 /100 | #47 | Exceptional 52.4% |
| Immigrants | Norway | 99.9 /100 | #48 | Exceptional 52.2% |
| Immigrants | Austria | 99.9 /100 | #49 | Exceptional 52.1% |
| Asians | 99.9 /100 | #50 | Exceptional 52.1% |
| Immigrants | Greece | 99.9 /100 | #51 | Exceptional 52.1% |
| Bolivians | 99.8 /100 | #52 | Exceptional 52.0% |
| Immigrants | Asia | 99.8 /100 | #53 | Exceptional 52.0% |
| Immigrants | Spain | 99.8 /100 | #54 | Exceptional 51.9% |
| Australians | 99.8 /100 | #55 | Exceptional 51.9% |
| Immigrants | Czechoslovakia | 99.8 /100 | #56 | Exceptional 51.9% |
| Paraguayans | 99.8 /100 | #57 | Exceptional 51.8% |
| New Zealanders | 99.8 /100 | #58 | Exceptional 51.8% |
| Immigrants | Serbia | 99.8 /100 | #59 | Exceptional 51.7% |
Demographics Similar to Soviet Union by Associate's Degree
In terms of associate's degree, the demographic groups most similar to Soviet Union are Eastern European (55.0%, a difference of 0.14%), Immigrants from Eastern Asia (55.4%, a difference of 0.47%), Immigrants from Hong Kong (55.4%, a difference of 0.50%), Indian (Asian) (54.8%, a difference of 0.61%), and Immigrants from China (55.5%, a difference of 0.65%).
| Demographics | Rating | Rank | Associate's Degree |
| Immigrants | Israel | 100.0 /100 | #9 | Exceptional 56.8% |
| Cypriots | 100.0 /100 | #10 | Exceptional 56.4% |
| Immigrants | Australia | 100.0 /100 | #11 | Exceptional 55.8% |
| Immigrants | South Central Asia | 100.0 /100 | #12 | Exceptional 55.7% |
| Immigrants | China | 100.0 /100 | #13 | Exceptional 55.5% |
| Immigrants | Hong Kong | 100.0 /100 | #14 | Exceptional 55.4% |
| Immigrants | Eastern Asia | 100.0 /100 | #15 | Exceptional 55.4% |
| Soviet Union | 100.0 /100 | #16 | Exceptional 55.1% |
| Eastern Europeans | 100.0 /100 | #17 | Exceptional 55.0% |
| Indians (Asian) | 100.0 /100 | #18 | Exceptional 54.8% |
| Immigrants | Ireland | 100.0 /100 | #19 | Exceptional 54.7% |
| Cambodians | 100.0 /100 | #20 | Exceptional 54.6% |
| Immigrants | Sweden | 100.0 /100 | #21 | Exceptional 54.6% |
| Immigrants | Japan | 100.0 /100 | #22 | Exceptional 54.6% |
| Burmese | 100.0 /100 | #23 | Exceptional 54.6% |