Black/African American vs Immigrants from Armenia Median Household Income
COMPARE
Black/African American
Immigrants from Armenia
Median Household Income
Median Household Income Comparison
Blacks/African Americans
Immigrants from Armenia
$67,573
MEDIAN HOUSEHOLD INCOME
0.0/ 100
METRIC RATING
334th/ 347
METRIC RANK
$83,555
MEDIAN HOUSEHOLD INCOME
27.0/ 100
METRIC RATING
195th/ 347
METRIC RANK
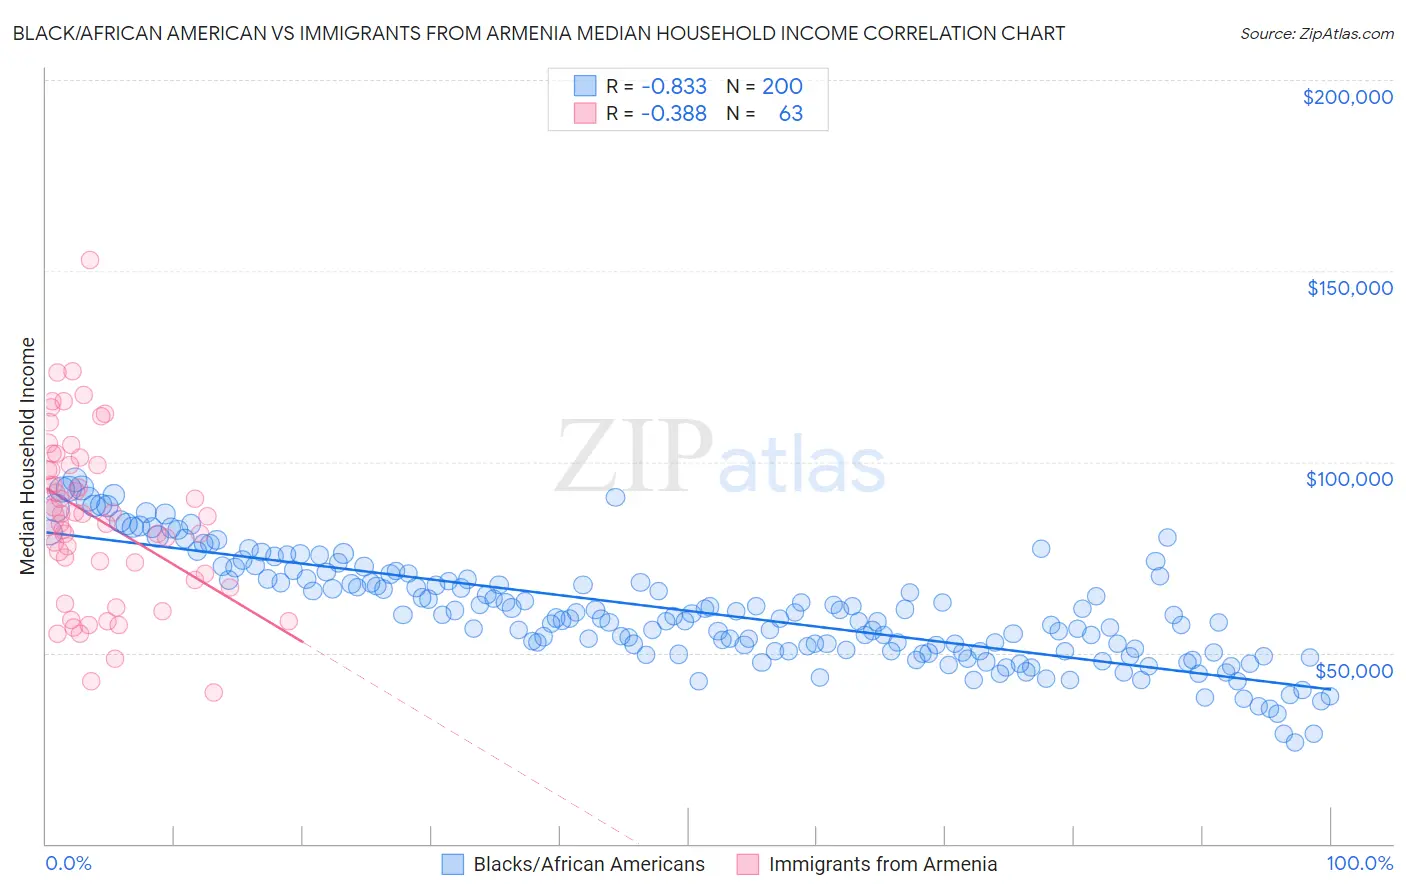
Black/African American vs Immigrants from Armenia Median Household Income Correlation Chart
The statistical analysis conducted on geographies consisting of 564,831,998 people shows a very strong negative correlation between the proportion of Blacks/African Americans and median household income in the United States with a correlation coefficient (R) of -0.833 and weighted average of $67,573. Similarly, the statistical analysis conducted on geographies consisting of 97,712,518 people shows a mild negative correlation between the proportion of Immigrants from Armenia and median household income in the United States with a correlation coefficient (R) of -0.388 and weighted average of $83,555, a difference of 23.6%.
Median Household Income Correlation Summary
| Measurement | Black/African American | Immigrants from Armenia |
| Minimum | $26,476 | $39,713 |
| Maximum | $95,304 | $152,803 |
| Range | $68,828 | $113,090 |
| Mean | $60,966 | $85,202 |
| Median | $59,295 | $85,651 |
| Interquartile 25% (IQ1) | $50,395 | $69,102 |
| Interquartile 75% (IQ3) | $69,686 | $99,318 |
| Interquartile Range (IQR) | $19,291 | $30,216 |
| Standard Deviation (Sample) | $14,297 | $22,242 |
| Standard Deviation (Population) | $14,261 | $22,064 |
Similar Demographics by Median Household Income
Demographics Similar to Blacks/African Americans by Median Household Income
In terms of median household income, the demographic groups most similar to Blacks/African Americans are Creek ($67,715, a difference of 0.21%), Sioux ($67,792, a difference of 0.32%), Native/Alaskan ($67,879, a difference of 0.45%), Arapaho ($67,965, a difference of 0.58%), and Cheyenne ($66,974, a difference of 0.89%).
| Demographics | Rating | Rank | Median Household Income |
| Immigrants | Cuba | 0.0 /100 | #327 | Tragic $68,461 |
| Menominee | 0.0 /100 | #328 | Tragic $68,423 |
| Dutch West Indians | 0.0 /100 | #329 | Tragic $68,412 |
| Arapaho | 0.0 /100 | #330 | Tragic $67,965 |
| Natives/Alaskans | 0.0 /100 | #331 | Tragic $67,879 |
| Sioux | 0.0 /100 | #332 | Tragic $67,792 |
| Creek | 0.0 /100 | #333 | Tragic $67,715 |
| Blacks/African Americans | 0.0 /100 | #334 | Tragic $67,573 |
| Cheyenne | 0.0 /100 | #335 | Tragic $66,974 |
| Immigrants | Congo | 0.0 /100 | #336 | Tragic $66,768 |
| Kiowa | 0.0 /100 | #337 | Tragic $65,914 |
| Immigrants | Yemen | 0.0 /100 | #338 | Tragic $65,194 |
| Hopi | 0.0 /100 | #339 | Tragic $65,043 |
| Pueblo | 0.0 /100 | #340 | Tragic $64,692 |
| Crow | 0.0 /100 | #341 | Tragic $63,681 |
Demographics Similar to Immigrants from Armenia by Median Household Income
In terms of median household income, the demographic groups most similar to Immigrants from Armenia are Ghanaian ($83,582, a difference of 0.030%), Finnish ($83,607, a difference of 0.060%), Welsh ($83,628, a difference of 0.090%), French ($83,468, a difference of 0.10%), and Aleut ($83,446, a difference of 0.13%).
| Demographics | Rating | Rank | Median Household Income |
| Tlingit-Haida | 32.6 /100 | #188 | Fair $83,968 |
| Immigrants | Colombia | 31.7 /100 | #189 | Fair $83,902 |
| Slovaks | 30.2 /100 | #190 | Fair $83,798 |
| Iraqis | 29.6 /100 | #191 | Fair $83,753 |
| Welsh | 28.0 /100 | #192 | Fair $83,628 |
| Finns | 27.7 /100 | #193 | Fair $83,607 |
| Ghanaians | 27.4 /100 | #194 | Fair $83,582 |
| Immigrants | Armenia | 27.0 /100 | #195 | Fair $83,555 |
| French | 26.0 /100 | #196 | Fair $83,468 |
| Aleuts | 25.7 /100 | #197 | Fair $83,446 |
| Japanese | 25.1 /100 | #198 | Fair $83,395 |
| Germans | 24.6 /100 | #199 | Fair $83,358 |
| Tsimshian | 24.5 /100 | #200 | Fair $83,346 |
| Spanish | 24.4 /100 | #201 | Fair $83,343 |
| Immigrants | Thailand | 24.3 /100 | #202 | Fair $83,327 |