Immigrants from Czechoslovakia vs Immigrants from Armenia Male Poverty
COMPARE
Immigrants from Czechoslovakia
Immigrants from Armenia
Male Poverty
Male Poverty Comparison
Immigrants from Czechoslovakia
Immigrants from Armenia
10.0%
MALE POVERTY
98.6/ 100
METRIC RATING
53rd/ 347
METRIC RANK
12.6%
MALE POVERTY
0.6/ 100
METRIC RATING
234th/ 347
METRIC RANK
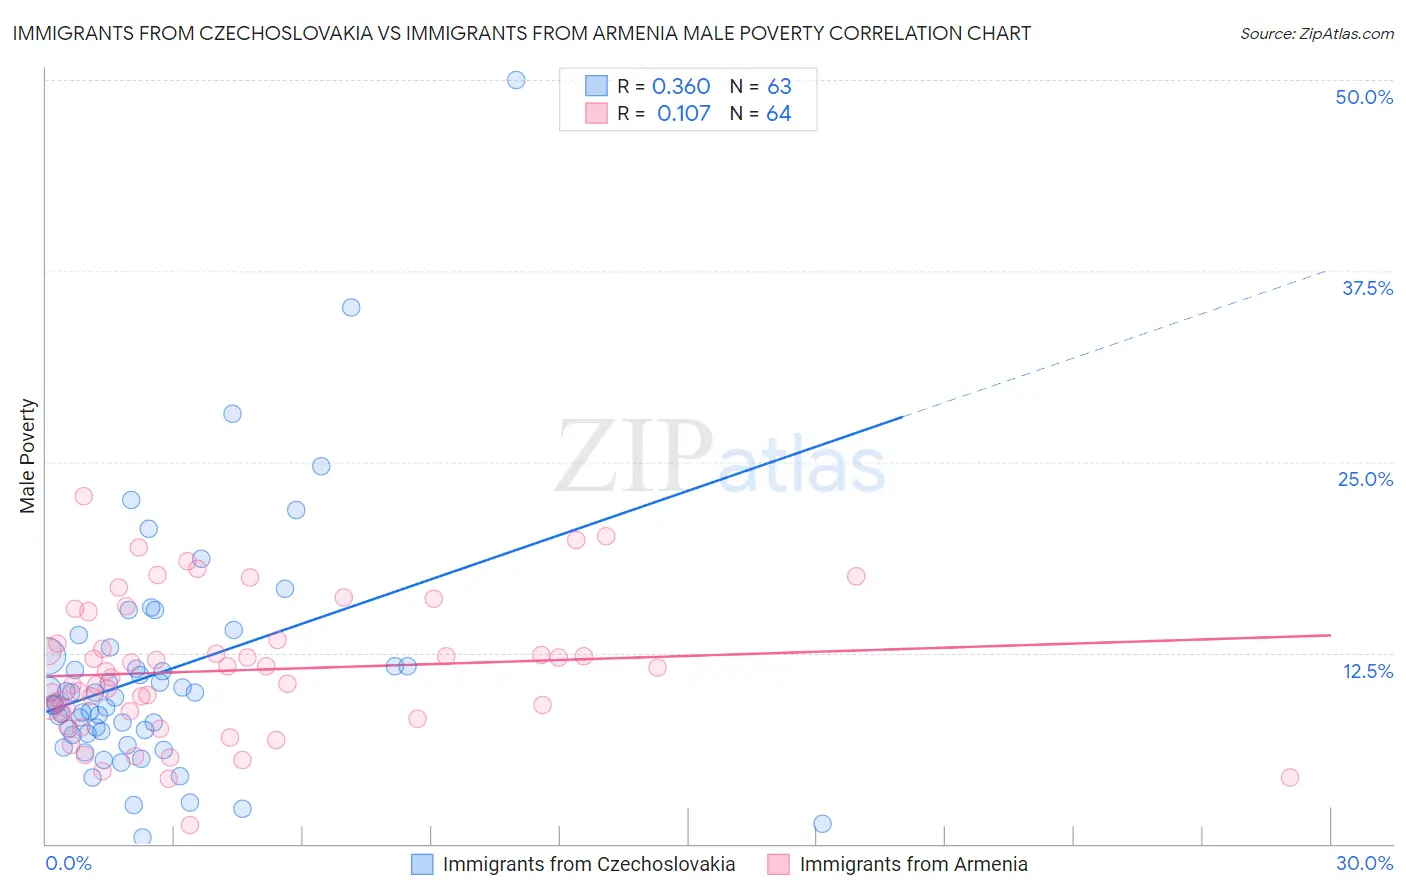
Immigrants from Czechoslovakia vs Immigrants from Armenia Male Poverty Correlation Chart
The statistical analysis conducted on geographies consisting of 195,424,226 people shows a mild positive correlation between the proportion of Immigrants from Czechoslovakia and poverty level among males in the United States with a correlation coefficient (R) of 0.360 and weighted average of 10.0%. Similarly, the statistical analysis conducted on geographies consisting of 97,715,591 people shows a poor positive correlation between the proportion of Immigrants from Armenia and poverty level among males in the United States with a correlation coefficient (R) of 0.107 and weighted average of 12.6%, a difference of 25.7%.
Male Poverty Correlation Summary
| Measurement | Immigrants from Czechoslovakia | Immigrants from Armenia |
| Minimum | 0.44% | 1.2% |
| Maximum | 50.0% | 22.8% |
| Range | 49.6% | 21.6% |
| Mean | 11.2% | 11.3% |
| Median | 9.2% | 11.1% |
| Interquartile 25% (IQ1) | 7.2% | 8.6% |
| Interquartile 75% (IQ3) | 12.2% | 13.2% |
| Interquartile Range (IQR) | 5.0% | 4.6% |
| Standard Deviation (Sample) | 8.0% | 4.4% |
| Standard Deviation (Population) | 7.9% | 4.4% |
Similar Demographics by Male Poverty
Demographics Similar to Immigrants from Czechoslovakia by Male Poverty
In terms of male poverty, the demographic groups most similar to Immigrants from Czechoslovakia are Asian (10.0%, a difference of 0.070%), Immigrants from Croatia (10.0%, a difference of 0.16%), Immigrants from Philippines (10.0%, a difference of 0.27%), Immigrants from Austria (10.0%, a difference of 0.28%), and Slovene (10.0%, a difference of 0.32%).
| Demographics | Rating | Rank | Male Poverty |
| Turks | 98.9 /100 | #46 | Exceptional 10.0% |
| Immigrants | Singapore | 98.8 /100 | #47 | Exceptional 10.0% |
| Immigrants | Japan | 98.8 /100 | #48 | Exceptional 10.0% |
| Slovenes | 98.8 /100 | #49 | Exceptional 10.0% |
| Immigrants | Philippines | 98.7 /100 | #50 | Exceptional 10.0% |
| Immigrants | Croatia | 98.7 /100 | #51 | Exceptional 10.0% |
| Asians | 98.7 /100 | #52 | Exceptional 10.0% |
| Immigrants | Czechoslovakia | 98.6 /100 | #53 | Exceptional 10.0% |
| Immigrants | Austria | 98.5 /100 | #54 | Exceptional 10.0% |
| Germans | 98.3 /100 | #55 | Exceptional 10.1% |
| Immigrants | Bulgaria | 98.2 /100 | #56 | Exceptional 10.1% |
| Estonians | 98.1 /100 | #57 | Exceptional 10.1% |
| Scandinavians | 98.0 /100 | #58 | Exceptional 10.1% |
| Immigrants | Europe | 97.9 /100 | #59 | Exceptional 10.1% |
| Ukrainians | 97.9 /100 | #60 | Exceptional 10.1% |
Demographics Similar to Immigrants from Armenia by Male Poverty
In terms of male poverty, the demographic groups most similar to Immigrants from Armenia are Fijian (12.6%, a difference of 0.060%), Nicaraguan (12.6%, a difference of 0.11%), Salvadoran (12.6%, a difference of 0.23%), Immigrants from Laos (12.6%, a difference of 0.36%), and Immigrants from Saudi Arabia (12.7%, a difference of 0.61%).
| Demographics | Rating | Rank | Male Poverty |
| Alaska Natives | 1.4 /100 | #227 | Tragic 12.4% |
| Alsatians | 1.3 /100 | #228 | Tragic 12.4% |
| Cubans | 1.3 /100 | #229 | Tragic 12.4% |
| Marshallese | 0.8 /100 | #230 | Tragic 12.5% |
| Salvadorans | 0.6 /100 | #231 | Tragic 12.6% |
| Nicaraguans | 0.6 /100 | #232 | Tragic 12.6% |
| Fijians | 0.6 /100 | #233 | Tragic 12.6% |
| Immigrants | Armenia | 0.6 /100 | #234 | Tragic 12.6% |
| Immigrants | Laos | 0.5 /100 | #235 | Tragic 12.6% |
| Immigrants | Saudi Arabia | 0.4 /100 | #236 | Tragic 12.7% |
| French American Indians | 0.4 /100 | #237 | Tragic 12.7% |
| Ecuadorians | 0.4 /100 | #238 | Tragic 12.7% |
| Ghanaians | 0.4 /100 | #239 | Tragic 12.7% |
| Immigrants | Middle Africa | 0.4 /100 | #240 | Tragic 12.7% |
| Sudanese | 0.3 /100 | #241 | Tragic 12.8% |