Black/African American vs Immigrants from Armenia 9th Grade
COMPARE
Black/African American
Immigrants from Armenia
9th Grade
9th Grade Comparison
Blacks/African Americans
Immigrants from Armenia
94.6%
9TH GRADE
20.5/ 100
METRIC RATING
201st/ 347
METRIC RANK
91.4%
9TH GRADE
0.0/ 100
METRIC RATING
326th/ 347
METRIC RANK
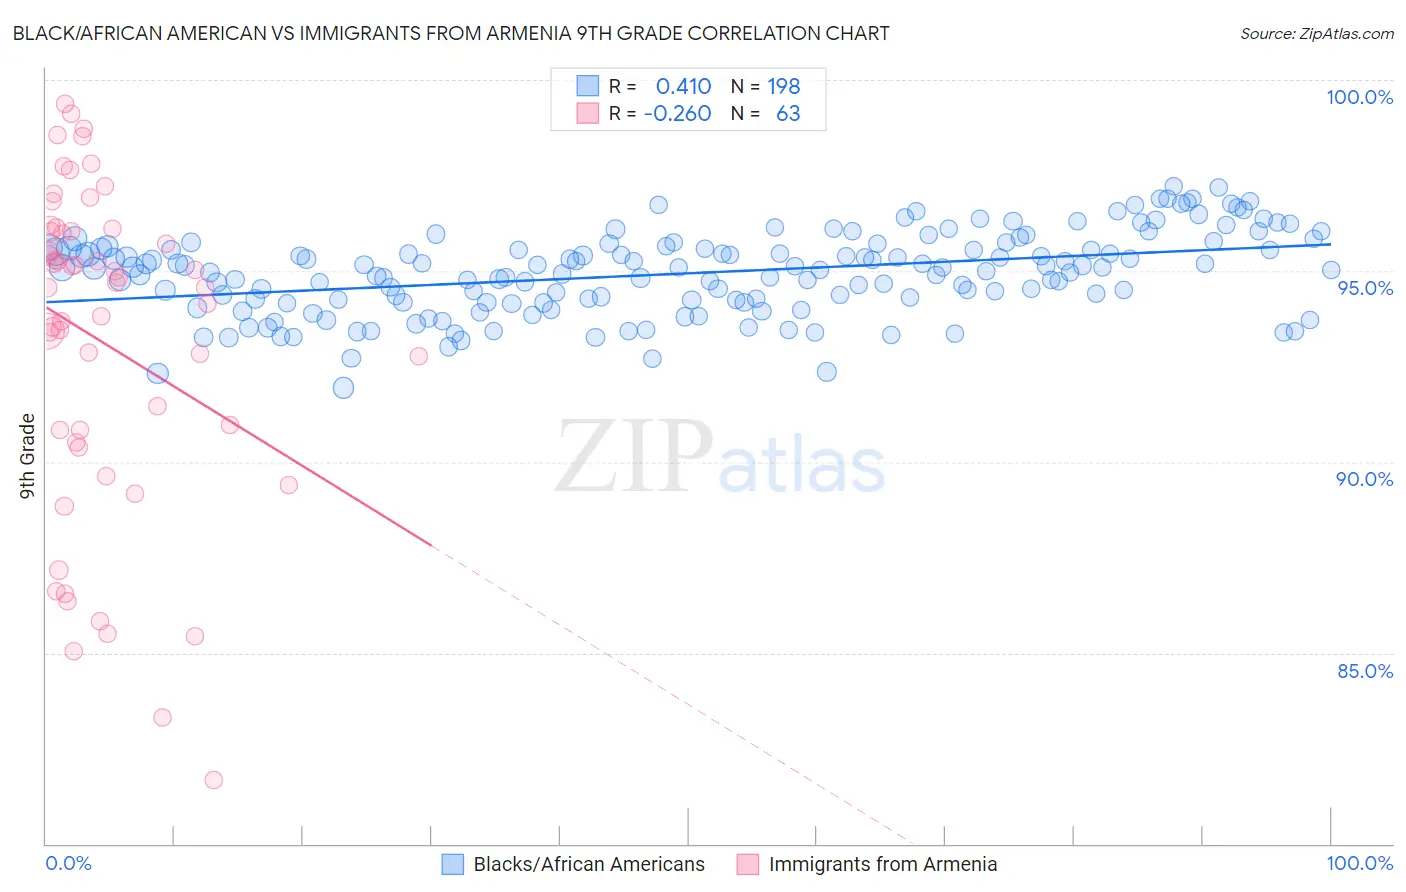
Black/African American vs Immigrants from Armenia 9th Grade Correlation Chart
The statistical analysis conducted on geographies consisting of 561,177,282 people shows a moderate positive correlation between the proportion of Blacks/African Americans and percentage of population with at least 9th grade education in the United States with a correlation coefficient (R) of 0.410 and weighted average of 94.6%. Similarly, the statistical analysis conducted on geographies consisting of 97,657,339 people shows a weak negative correlation between the proportion of Immigrants from Armenia and percentage of population with at least 9th grade education in the United States with a correlation coefficient (R) of -0.260 and weighted average of 91.4%, a difference of 3.6%.
9th Grade Correlation Summary
| Measurement | Black/African American | Immigrants from Armenia |
| Minimum | 91.9% | 81.7% |
| Maximum | 97.2% | 99.4% |
| Range | 5.3% | 17.7% |
| Mean | 94.9% | 93.1% |
| Median | 95.1% | 94.6% |
| Interquartile 25% (IQ1) | 94.2% | 90.5% |
| Interquartile 75% (IQ3) | 95.6% | 96.0% |
| Interquartile Range (IQR) | 1.4% | 5.5% |
| Standard Deviation (Sample) | 1.1% | 4.3% |
| Standard Deviation (Population) | 1.1% | 4.2% |
Similar Demographics by 9th Grade
Demographics Similar to Blacks/African Americans by 9th Grade
In terms of 9th grade, the demographic groups most similar to Blacks/African Americans are Immigrants from Zaire (94.6%, a difference of 0.0%), Laotian (94.6%, a difference of 0.010%), Immigrants from Eastern Asia (94.6%, a difference of 0.010%), Immigrants from Bahamas (94.6%, a difference of 0.010%), and Moroccan (94.6%, a difference of 0.010%).
| Demographics | Rating | Rank | 9th Grade |
| Panamanians | 29.0 /100 | #194 | Fair 94.7% |
| Marshallese | 27.9 /100 | #195 | Fair 94.7% |
| Immigrants | Lebanon | 27.2 /100 | #196 | Fair 94.7% |
| Immigrants | Micronesia | 24.7 /100 | #197 | Fair 94.7% |
| Hawaiians | 22.7 /100 | #198 | Fair 94.7% |
| Laotians | 21.0 /100 | #199 | Fair 94.6% |
| Immigrants | Zaire | 20.6 /100 | #200 | Fair 94.6% |
| Blacks/African Americans | 20.5 /100 | #201 | Fair 94.6% |
| Immigrants | Eastern Asia | 19.8 /100 | #202 | Poor 94.6% |
| Immigrants | Bahamas | 19.8 /100 | #203 | Poor 94.6% |
| Moroccans | 19.6 /100 | #204 | Poor 94.6% |
| Immigrants | Sudan | 17.6 /100 | #205 | Poor 94.6% |
| Samoans | 17.3 /100 | #206 | Poor 94.6% |
| Immigrants | Morocco | 16.3 /100 | #207 | Poor 94.6% |
| Immigrants | Pakistan | 15.5 /100 | #208 | Poor 94.6% |
Demographics Similar to Immigrants from Armenia by 9th Grade
In terms of 9th grade, the demographic groups most similar to Immigrants from Armenia are Immigrants from Nicaragua (91.3%, a difference of 0.050%), Central American Indian (91.5%, a difference of 0.10%), Dominican (91.1%, a difference of 0.34%), Honduran (91.0%, a difference of 0.37%), and Immigrants from Belize (91.8%, a difference of 0.43%).
| Demographics | Rating | Rank | 9th Grade |
| Ecuadorians | 0.0 /100 | #319 | Tragic 91.9% |
| Nicaraguans | 0.0 /100 | #320 | Tragic 91.9% |
| Immigrants | Ecuador | 0.0 /100 | #321 | Tragic 91.8% |
| Belizeans | 0.0 /100 | #322 | Tragic 91.8% |
| Puerto Ricans | 0.0 /100 | #323 | Tragic 91.8% |
| Immigrants | Belize | 0.0 /100 | #324 | Tragic 91.8% |
| Central American Indians | 0.0 /100 | #325 | Tragic 91.5% |
| Immigrants | Armenia | 0.0 /100 | #326 | Tragic 91.4% |
| Immigrants | Nicaragua | 0.0 /100 | #327 | Tragic 91.3% |
| Dominicans | 0.0 /100 | #328 | Tragic 91.1% |
| Hondurans | 0.0 /100 | #329 | Tragic 91.0% |
| Immigrants | Cabo Verde | 0.0 /100 | #330 | Tragic 90.9% |
| Mexican American Indians | 0.0 /100 | #331 | Tragic 90.9% |
| Hispanics or Latinos | 0.0 /100 | #332 | Tragic 90.9% |
| Immigrants | Yemen | 0.0 /100 | #333 | Tragic 90.8% |