Bermudan vs Immigrants from Armenia Male Poverty
COMPARE
Bermudan
Immigrants from Armenia
Male Poverty
Male Poverty Comparison
Bermudans
Immigrants from Armenia
12.2%
MALE POVERTY
2.4/ 100
METRIC RATING
219th/ 347
METRIC RANK
12.6%
MALE POVERTY
0.6/ 100
METRIC RATING
234th/ 347
METRIC RANK
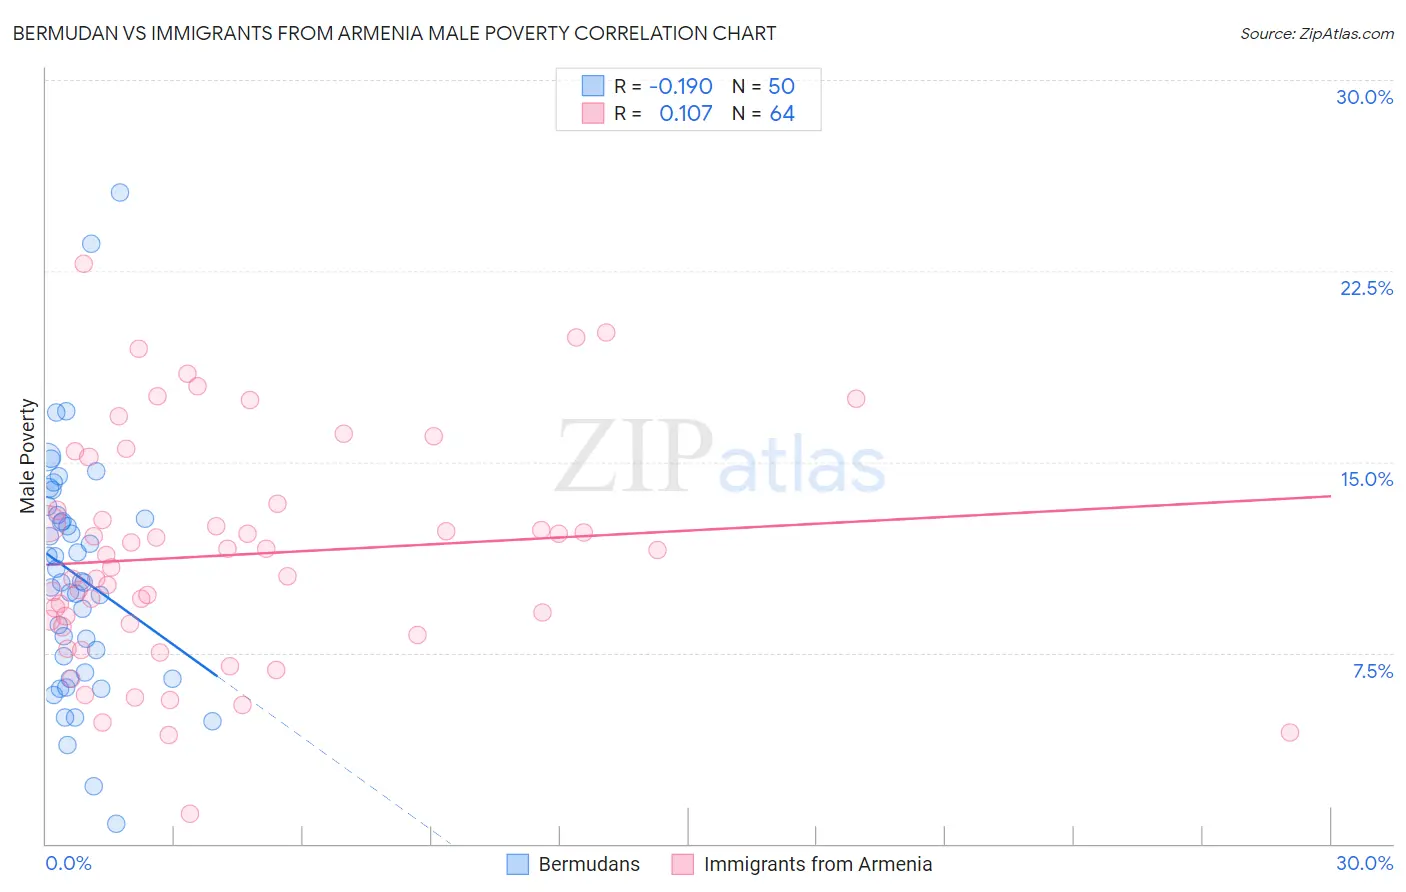
Bermudan vs Immigrants from Armenia Male Poverty Correlation Chart
The statistical analysis conducted on geographies consisting of 55,715,607 people shows a poor negative correlation between the proportion of Bermudans and poverty level among males in the United States with a correlation coefficient (R) of -0.190 and weighted average of 12.2%. Similarly, the statistical analysis conducted on geographies consisting of 97,715,591 people shows a poor positive correlation between the proportion of Immigrants from Armenia and poverty level among males in the United States with a correlation coefficient (R) of 0.107 and weighted average of 12.6%, a difference of 3.2%.
Male Poverty Correlation Summary
| Measurement | Bermudan | Immigrants from Armenia |
| Minimum | 0.81% | 1.2% |
| Maximum | 25.6% | 22.8% |
| Range | 24.8% | 21.6% |
| Mean | 10.5% | 11.3% |
| Median | 10.3% | 11.1% |
| Interquartile 25% (IQ1) | 6.7% | 8.6% |
| Interquartile 75% (IQ3) | 12.9% | 13.2% |
| Interquartile Range (IQR) | 6.2% | 4.6% |
| Standard Deviation (Sample) | 4.7% | 4.4% |
| Standard Deviation (Population) | 4.7% | 4.4% |
Demographics Similar to Bermudans and Immigrants from Armenia by Male Poverty
In terms of male poverty, the demographic groups most similar to Bermudans are Immigrants from Eritrea (12.2%, a difference of 0.020%), German Russian (12.2%, a difference of 0.070%), Immigrants from Thailand (12.2%, a difference of 0.090%), Immigrants from Cambodia (12.2%, a difference of 0.10%), and Ugandan (12.2%, a difference of 0.23%). Similarly, the demographic groups most similar to Immigrants from Armenia are Fijian (12.6%, a difference of 0.060%), Nicaraguan (12.6%, a difference of 0.11%), Salvadoran (12.6%, a difference of 0.23%), Immigrants from Laos (12.6%, a difference of 0.36%), and Immigrants from Saudi Arabia (12.7%, a difference of 0.61%).
| Demographics | Rating | Rank | Male Poverty |
| Immigrants | Cambodia | 2.5 /100 | #216 | Tragic 12.2% |
| Immigrants | Thailand | 2.5 /100 | #217 | Tragic 12.2% |
| German Russians | 2.5 /100 | #218 | Tragic 12.2% |
| Bermudans | 2.4 /100 | #219 | Tragic 12.2% |
| Immigrants | Eritrea | 2.4 /100 | #220 | Tragic 12.2% |
| Ugandans | 2.2 /100 | #221 | Tragic 12.2% |
| Immigrants | Africa | 2.1 /100 | #222 | Tragic 12.2% |
| Immigrants | Micronesia | 2.1 /100 | #223 | Tragic 12.2% |
| Immigrants | Nigeria | 1.6 /100 | #224 | Tragic 12.3% |
| Osage | 1.5 /100 | #225 | Tragic 12.3% |
| Nigerians | 1.4 /100 | #226 | Tragic 12.3% |
| Alaska Natives | 1.4 /100 | #227 | Tragic 12.4% |
| Alsatians | 1.3 /100 | #228 | Tragic 12.4% |
| Cubans | 1.3 /100 | #229 | Tragic 12.4% |
| Marshallese | 0.8 /100 | #230 | Tragic 12.5% |
| Salvadorans | 0.6 /100 | #231 | Tragic 12.6% |
| Nicaraguans | 0.6 /100 | #232 | Tragic 12.6% |
| Fijians | 0.6 /100 | #233 | Tragic 12.6% |
| Immigrants | Armenia | 0.6 /100 | #234 | Tragic 12.6% |
| Immigrants | Laos | 0.5 /100 | #235 | Tragic 12.6% |
| Immigrants | Saudi Arabia | 0.4 /100 | #236 | Tragic 12.7% |