American vs Immigrants from Armenia Male Poverty
COMPARE
American
Immigrants from Armenia
Male Poverty
Male Poverty Comparison
Americans
Immigrants from Armenia
12.1%
MALE POVERTY
3.2/ 100
METRIC RATING
212th/ 347
METRIC RANK
12.6%
MALE POVERTY
0.6/ 100
METRIC RATING
234th/ 347
METRIC RANK
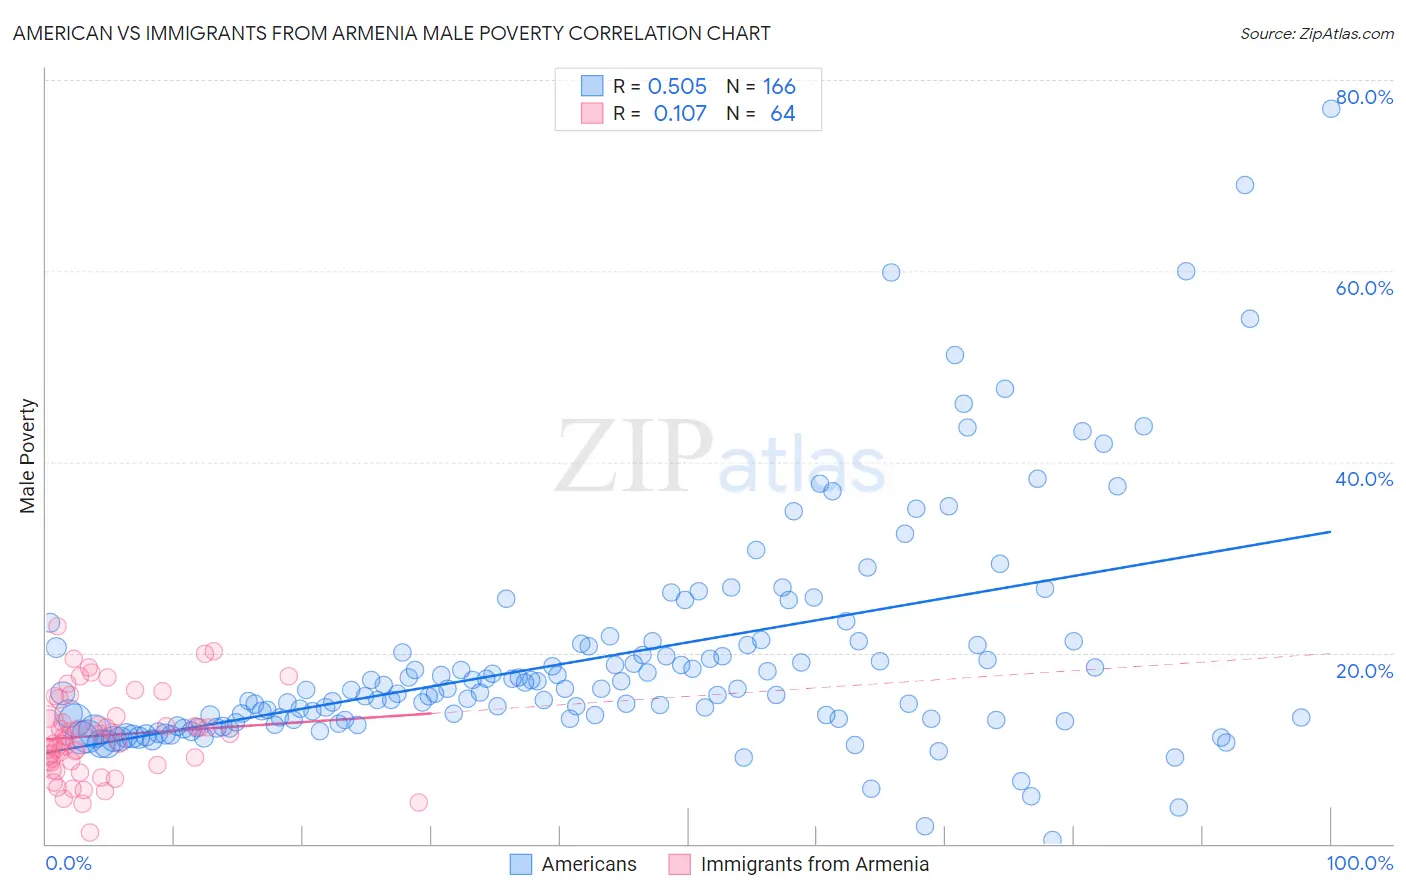
American vs Immigrants from Armenia Male Poverty Correlation Chart
The statistical analysis conducted on geographies consisting of 579,982,816 people shows a substantial positive correlation between the proportion of Americans and poverty level among males in the United States with a correlation coefficient (R) of 0.505 and weighted average of 12.1%. Similarly, the statistical analysis conducted on geographies consisting of 97,715,591 people shows a poor positive correlation between the proportion of Immigrants from Armenia and poverty level among males in the United States with a correlation coefficient (R) of 0.107 and weighted average of 12.6%, a difference of 3.9%.
Male Poverty Correlation Summary
| Measurement | American | Immigrants from Armenia |
| Minimum | 0.36% | 1.2% |
| Maximum | 77.0% | 22.8% |
| Range | 76.7% | 21.6% |
| Mean | 19.4% | 11.3% |
| Median | 15.8% | 11.1% |
| Interquartile 25% (IQ1) | 12.9% | 8.6% |
| Interquartile 75% (IQ3) | 20.8% | 13.2% |
| Interquartile Range (IQR) | 7.9% | 4.6% |
| Standard Deviation (Sample) | 11.9% | 4.4% |
| Standard Deviation (Population) | 11.8% | 4.4% |
Similar Demographics by Male Poverty
Demographics Similar to Americans by Male Poverty
In terms of male poverty, the demographic groups most similar to Americans are Nonimmigrants (12.1%, a difference of 0.040%), Japanese (12.2%, a difference of 0.35%), Immigrants from Uzbekistan (12.2%, a difference of 0.47%), Immigrants from Cambodia (12.2%, a difference of 0.55%), and Immigrants from Panama (12.1%, a difference of 0.56%).
| Demographics | Rating | Rank | Male Poverty |
| Panamanians | 6.2 /100 | #205 | Tragic 11.9% |
| Immigrants | Eastern Africa | 5.4 /100 | #206 | Tragic 12.0% |
| Malaysians | 5.2 /100 | #207 | Tragic 12.0% |
| Immigrants | Immigrants | 4.5 /100 | #208 | Tragic 12.0% |
| Immigrants | Azores | 4.3 /100 | #209 | Tragic 12.0% |
| Moroccans | 4.2 /100 | #210 | Tragic 12.0% |
| Immigrants | Panama | 4.0 /100 | #211 | Tragic 12.1% |
| Americans | 3.2 /100 | #212 | Tragic 12.1% |
| Immigrants | Nonimmigrants | 3.1 /100 | #213 | Tragic 12.1% |
| Japanese | 2.7 /100 | #214 | Tragic 12.2% |
| Immigrants | Uzbekistan | 2.6 /100 | #215 | Tragic 12.2% |
| Immigrants | Cambodia | 2.5 /100 | #216 | Tragic 12.2% |
| Immigrants | Thailand | 2.5 /100 | #217 | Tragic 12.2% |
| German Russians | 2.5 /100 | #218 | Tragic 12.2% |
| Bermudans | 2.4 /100 | #219 | Tragic 12.2% |
Demographics Similar to Immigrants from Armenia by Male Poverty
In terms of male poverty, the demographic groups most similar to Immigrants from Armenia are Fijian (12.6%, a difference of 0.060%), Nicaraguan (12.6%, a difference of 0.11%), Salvadoran (12.6%, a difference of 0.23%), Immigrants from Laos (12.6%, a difference of 0.36%), and Immigrants from Saudi Arabia (12.7%, a difference of 0.61%).
| Demographics | Rating | Rank | Male Poverty |
| Alaska Natives | 1.4 /100 | #227 | Tragic 12.4% |
| Alsatians | 1.3 /100 | #228 | Tragic 12.4% |
| Cubans | 1.3 /100 | #229 | Tragic 12.4% |
| Marshallese | 0.8 /100 | #230 | Tragic 12.5% |
| Salvadorans | 0.6 /100 | #231 | Tragic 12.6% |
| Nicaraguans | 0.6 /100 | #232 | Tragic 12.6% |
| Fijians | 0.6 /100 | #233 | Tragic 12.6% |
| Immigrants | Armenia | 0.6 /100 | #234 | Tragic 12.6% |
| Immigrants | Laos | 0.5 /100 | #235 | Tragic 12.6% |
| Immigrants | Saudi Arabia | 0.4 /100 | #236 | Tragic 12.7% |
| French American Indians | 0.4 /100 | #237 | Tragic 12.7% |
| Ecuadorians | 0.4 /100 | #238 | Tragic 12.7% |
| Ghanaians | 0.4 /100 | #239 | Tragic 12.7% |
| Immigrants | Middle Africa | 0.4 /100 | #240 | Tragic 12.7% |
| Sudanese | 0.3 /100 | #241 | Tragic 12.8% |