Bhutanese vs Hungarian Receiving Food Stamps
COMPARE
Bhutanese
Hungarian
Receiving Food Stamps
Receiving Food Stamps Comparison
Bhutanese
Hungarians
9.2%
RECEIVING FOOD STAMPS
99.8/ 100
METRIC RATING
27th/ 347
METRIC RANK
11.0%
RECEIVING FOOD STAMPS
85.1/ 100
METRIC RATING
145th/ 347
METRIC RANK
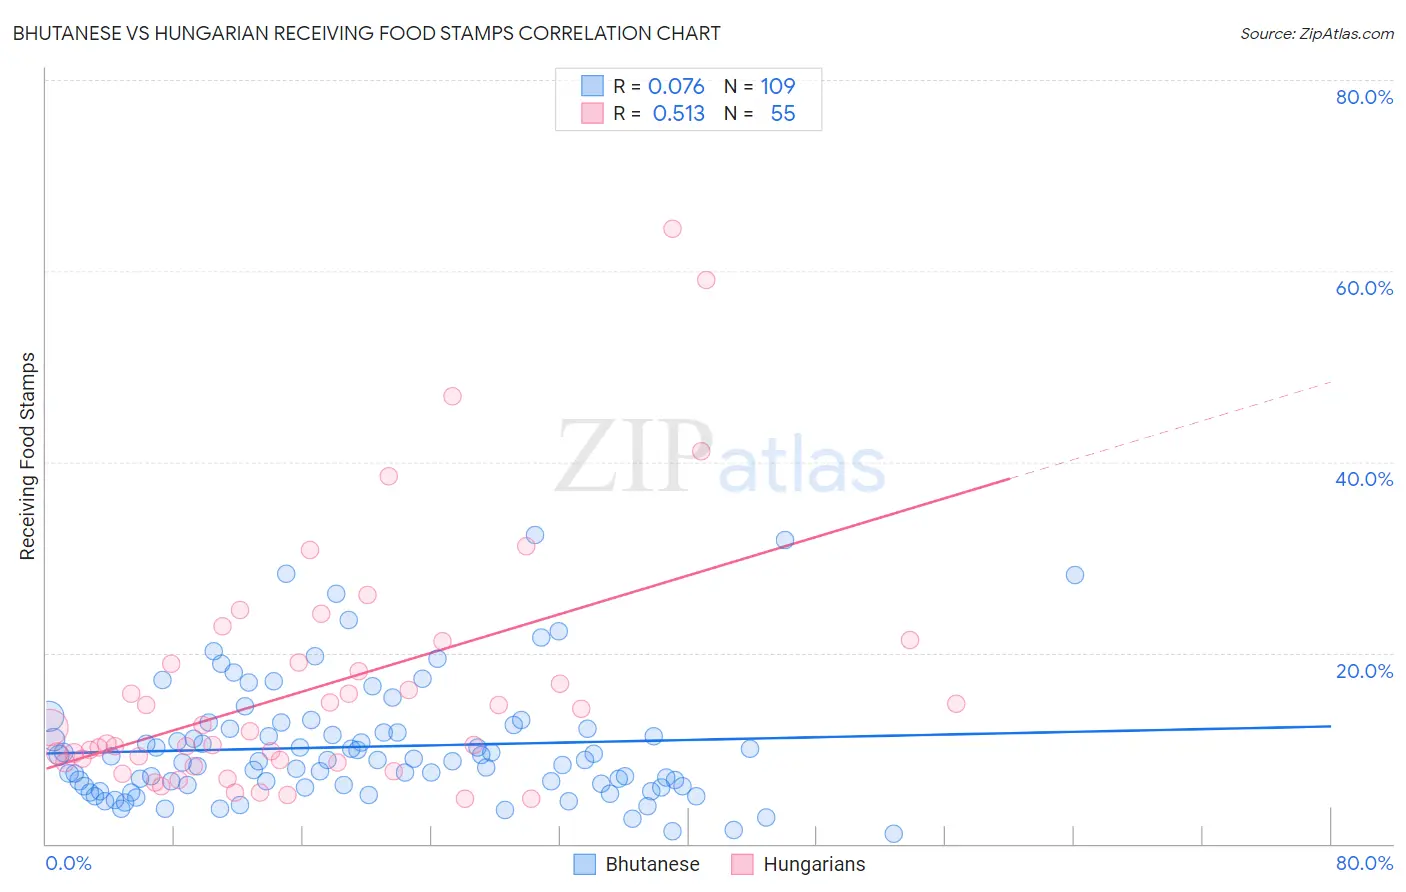
Bhutanese vs Hungarian Receiving Food Stamps Correlation Chart
The statistical analysis conducted on geographies consisting of 453,770,052 people shows a slight positive correlation between the proportion of Bhutanese and percentage of population receiving government assistance and/or food stamps in the United States with a correlation coefficient (R) of 0.076 and weighted average of 9.2%. Similarly, the statistical analysis conducted on geographies consisting of 483,983,942 people shows a substantial positive correlation between the proportion of Hungarians and percentage of population receiving government assistance and/or food stamps in the United States with a correlation coefficient (R) of 0.513 and weighted average of 11.0%, a difference of 19.6%.
Receiving Food Stamps Correlation Summary
| Measurement | Bhutanese | Hungarian |
| Minimum | 1.0% | 4.7% |
| Maximum | 32.4% | 64.4% |
| Range | 31.4% | 59.7% |
| Mean | 10.2% | 16.3% |
| Median | 8.8% | 11.7% |
| Interquartile 25% (IQ1) | 6.0% | 8.5% |
| Interquartile 75% (IQ3) | 12.0% | 19.0% |
| Interquartile Range (IQR) | 6.0% | 10.5% |
| Standard Deviation (Sample) | 6.3% | 12.9% |
| Standard Deviation (Population) | 6.3% | 12.7% |
Similar Demographics by Receiving Food Stamps
Demographics Similar to Bhutanese by Receiving Food Stamps
In terms of receiving food stamps, the demographic groups most similar to Bhutanese are Czech (9.2%, a difference of 0.010%), Swedish (9.2%, a difference of 0.24%), Immigrants from Lithuania (9.2%, a difference of 0.28%), Immigrants from Ireland (9.2%, a difference of 0.43%), and Immigrants from Northern Europe (9.2%, a difference of 0.54%).
| Demographics | Rating | Rank | Receiving Food Stamps |
| Latvians | 99.8 /100 | #20 | Exceptional 9.1% |
| Luxembourgers | 99.8 /100 | #21 | Exceptional 9.1% |
| Immigrants | Australia | 99.8 /100 | #22 | Exceptional 9.2% |
| Eastern Europeans | 99.8 /100 | #23 | Exceptional 9.2% |
| Immigrants | Northern Europe | 99.8 /100 | #24 | Exceptional 9.2% |
| Immigrants | Ireland | 99.8 /100 | #25 | Exceptional 9.2% |
| Swedes | 99.8 /100 | #26 | Exceptional 9.2% |
| Bhutanese | 99.8 /100 | #27 | Exceptional 9.2% |
| Czechs | 99.8 /100 | #28 | Exceptional 9.2% |
| Immigrants | Lithuania | 99.8 /100 | #29 | Exceptional 9.2% |
| Immigrants | Sweden | 99.7 /100 | #30 | Exceptional 9.3% |
| Immigrants | Eastern Asia | 99.7 /100 | #31 | Exceptional 9.3% |
| Bolivians | 99.7 /100 | #32 | Exceptional 9.3% |
| Zimbabweans | 99.6 /100 | #33 | Exceptional 9.5% |
| Turks | 99.6 /100 | #34 | Exceptional 9.5% |
Demographics Similar to Hungarians by Receiving Food Stamps
In terms of receiving food stamps, the demographic groups most similar to Hungarians are Syrian (11.0%, a difference of 0.12%), Taiwanese (11.0%, a difference of 0.24%), Immigrants from Northern Africa (11.0%, a difference of 0.27%), White/Caucasian (11.1%, a difference of 0.34%), and Chilean (11.0%, a difference of 0.35%).
| Demographics | Rating | Rank | Receiving Food Stamps |
| Immigrants | Moldova | 88.5 /100 | #138 | Excellent 10.9% |
| Hmong | 88.4 /100 | #139 | Excellent 10.9% |
| Celtics | 87.8 /100 | #140 | Excellent 10.9% |
| Immigrants | Vietnam | 86.7 /100 | #141 | Excellent 11.0% |
| Chileans | 86.2 /100 | #142 | Excellent 11.0% |
| Immigrants | Northern Africa | 86.0 /100 | #143 | Excellent 11.0% |
| Syrians | 85.5 /100 | #144 | Excellent 11.0% |
| Hungarians | 85.1 /100 | #145 | Excellent 11.0% |
| Taiwanese | 84.2 /100 | #146 | Excellent 11.0% |
| Whites/Caucasians | 83.9 /100 | #147 | Excellent 11.1% |
| Immigrants | South Eastern Asia | 83.3 /100 | #148 | Excellent 11.1% |
| Brazilians | 83.2 /100 | #149 | Excellent 11.1% |
| Soviet Union | 83.1 /100 | #150 | Excellent 11.1% |
| Immigrants | Spain | 81.7 /100 | #151 | Excellent 11.1% |
| Immigrants | Kazakhstan | 81.7 /100 | #152 | Excellent 11.1% |