Cree vs Hungarian Receiving Food Stamps
COMPARE
Cree
Hungarian
Receiving Food Stamps
Receiving Food Stamps Comparison
Cree
Hungarians
13.7%
RECEIVING FOOD STAMPS
0.8/ 100
METRIC RATING
246th/ 347
METRIC RANK
11.0%
RECEIVING FOOD STAMPS
85.1/ 100
METRIC RATING
145th/ 347
METRIC RANK
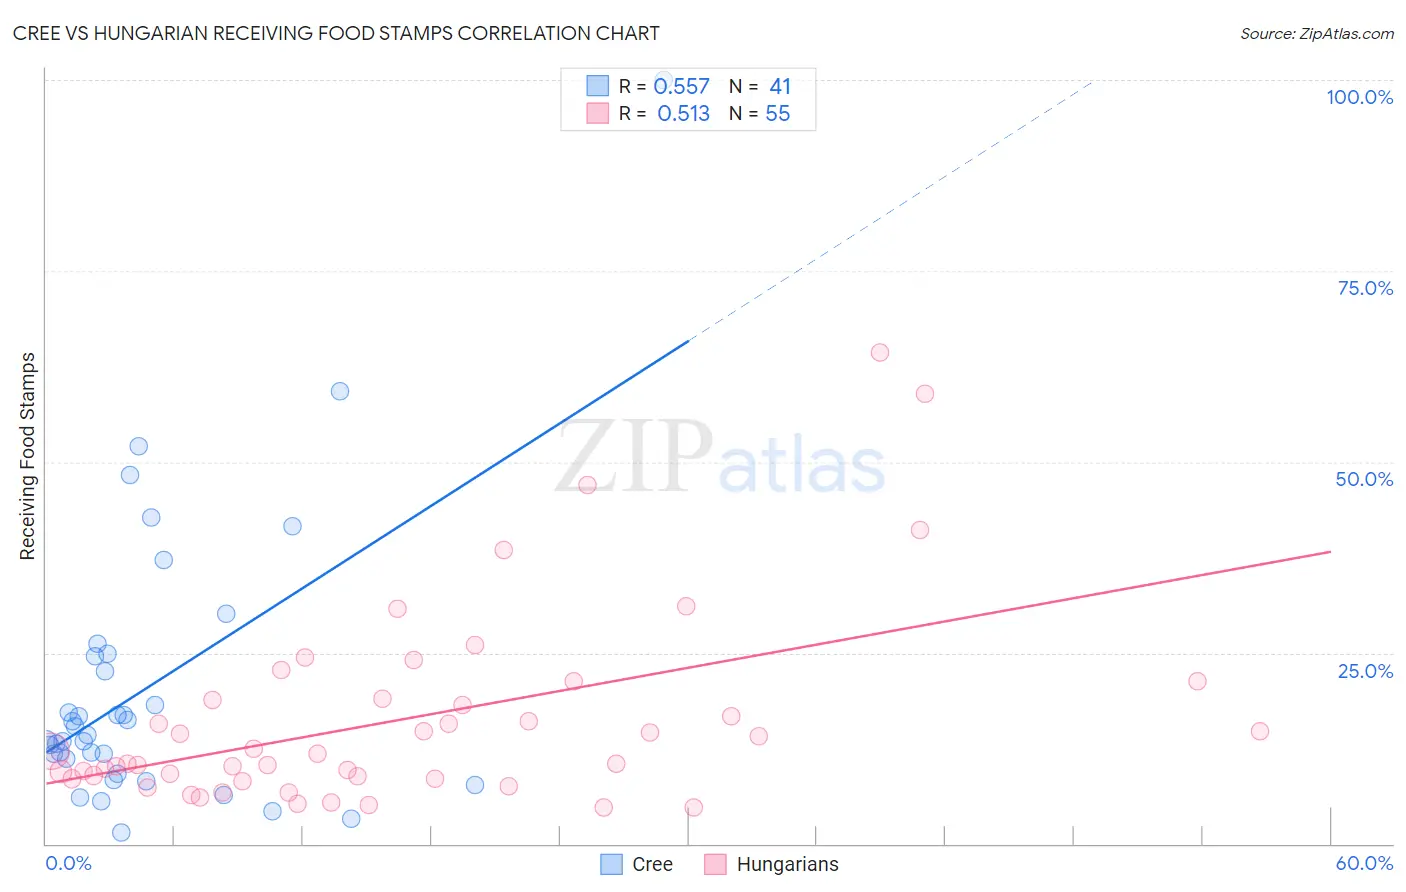
Cree vs Hungarian Receiving Food Stamps Correlation Chart
The statistical analysis conducted on geographies consisting of 76,186,239 people shows a substantial positive correlation between the proportion of Cree and percentage of population receiving government assistance and/or food stamps in the United States with a correlation coefficient (R) of 0.557 and weighted average of 13.7%. Similarly, the statistical analysis conducted on geographies consisting of 483,983,942 people shows a substantial positive correlation between the proportion of Hungarians and percentage of population receiving government assistance and/or food stamps in the United States with a correlation coefficient (R) of 0.513 and weighted average of 11.0%, a difference of 24.5%.
Receiving Food Stamps Correlation Summary
| Measurement | Cree | Hungarian |
| Minimum | 1.5% | 4.7% |
| Maximum | 100.0% | 64.4% |
| Range | 98.5% | 59.7% |
| Mean | 20.6% | 16.3% |
| Median | 14.2% | 11.7% |
| Interquartile 25% (IQ1) | 10.1% | 8.5% |
| Interquartile 75% (IQ3) | 24.7% | 19.0% |
| Interquartile Range (IQR) | 14.6% | 10.5% |
| Standard Deviation (Sample) | 18.6% | 12.9% |
| Standard Deviation (Population) | 18.4% | 12.7% |
Similar Demographics by Receiving Food Stamps
Demographics Similar to Cree by Receiving Food Stamps
In terms of receiving food stamps, the demographic groups most similar to Cree are Immigrants from Somalia (13.7%, a difference of 0.24%), Mexican American Indian (13.8%, a difference of 0.27%), Cajun (13.7%, a difference of 0.28%), Immigrants from Laos (13.8%, a difference of 0.36%), and Somali (13.7%, a difference of 0.44%).
| Demographics | Rating | Rank | Receiving Food Stamps |
| Immigrants | Micronesia | 1.3 /100 | #239 | Tragic 13.5% |
| Iroquois | 1.2 /100 | #240 | Tragic 13.5% |
| Choctaw | 1.0 /100 | #241 | Tragic 13.6% |
| Immigrants | Panama | 1.0 /100 | #242 | Tragic 13.6% |
| Somalis | 0.9 /100 | #243 | Tragic 13.7% |
| Cajuns | 0.9 /100 | #244 | Tragic 13.7% |
| Immigrants | Somalia | 0.9 /100 | #245 | Tragic 13.7% |
| Cree | 0.8 /100 | #246 | Tragic 13.7% |
| Mexican American Indians | 0.7 /100 | #247 | Tragic 13.8% |
| Immigrants | Laos | 0.7 /100 | #248 | Tragic 13.8% |
| Indonesians | 0.6 /100 | #249 | Tragic 13.9% |
| Immigrants | Cambodia | 0.5 /100 | #250 | Tragic 13.9% |
| Yaqui | 0.5 /100 | #251 | Tragic 13.9% |
| Ghanaians | 0.5 /100 | #252 | Tragic 14.0% |
| Spanish Americans | 0.4 /100 | #253 | Tragic 14.0% |
Demographics Similar to Hungarians by Receiving Food Stamps
In terms of receiving food stamps, the demographic groups most similar to Hungarians are Syrian (11.0%, a difference of 0.12%), Taiwanese (11.0%, a difference of 0.24%), Immigrants from Northern Africa (11.0%, a difference of 0.27%), White/Caucasian (11.1%, a difference of 0.34%), and Chilean (11.0%, a difference of 0.35%).
| Demographics | Rating | Rank | Receiving Food Stamps |
| Immigrants | Moldova | 88.5 /100 | #138 | Excellent 10.9% |
| Hmong | 88.4 /100 | #139 | Excellent 10.9% |
| Celtics | 87.8 /100 | #140 | Excellent 10.9% |
| Immigrants | Vietnam | 86.7 /100 | #141 | Excellent 11.0% |
| Chileans | 86.2 /100 | #142 | Excellent 11.0% |
| Immigrants | Northern Africa | 86.0 /100 | #143 | Excellent 11.0% |
| Syrians | 85.5 /100 | #144 | Excellent 11.0% |
| Hungarians | 85.1 /100 | #145 | Excellent 11.0% |
| Taiwanese | 84.2 /100 | #146 | Excellent 11.0% |
| Whites/Caucasians | 83.9 /100 | #147 | Excellent 11.1% |
| Immigrants | South Eastern Asia | 83.3 /100 | #148 | Excellent 11.1% |
| Brazilians | 83.2 /100 | #149 | Excellent 11.1% |
| Soviet Union | 83.1 /100 | #150 | Excellent 11.1% |
| Immigrants | Spain | 81.7 /100 | #151 | Excellent 11.1% |
| Immigrants | Kazakhstan | 81.7 /100 | #152 | Excellent 11.1% |