Bhutanese vs U.S. Virgin Islander Receiving Food Stamps
COMPARE
Bhutanese
U.S. Virgin Islander
Receiving Food Stamps
Receiving Food Stamps Comparison
Bhutanese
U.S. Virgin Islanders
9.2%
RECEIVING FOOD STAMPS
99.8/ 100
METRIC RATING
27th/ 347
METRIC RANK
16.5%
RECEIVING FOOD STAMPS
0.0/ 100
METRIC RATING
309th/ 347
METRIC RANK
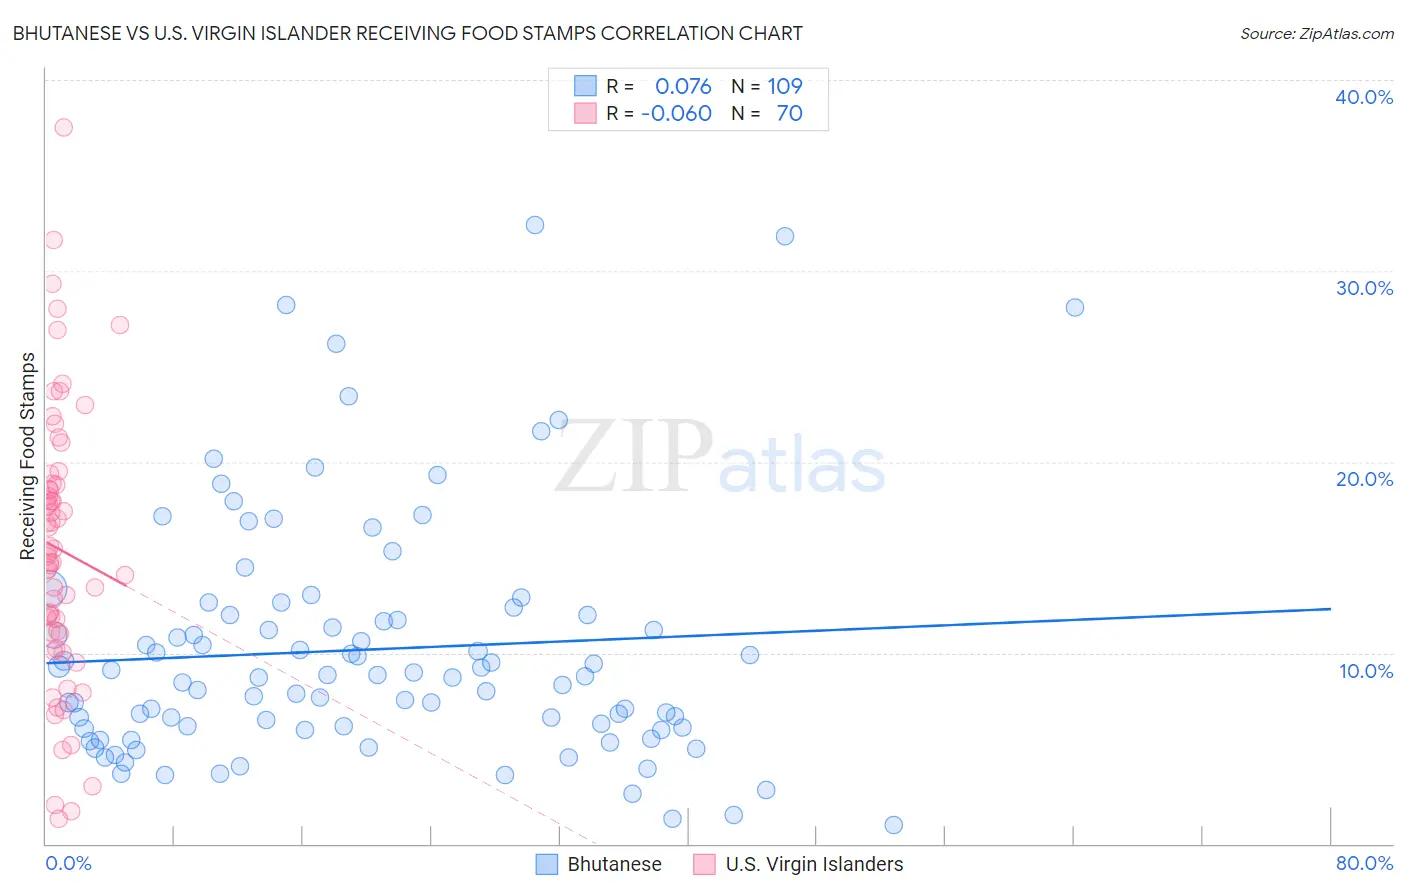
Bhutanese vs U.S. Virgin Islander Receiving Food Stamps Correlation Chart
The statistical analysis conducted on geographies consisting of 453,770,052 people shows a slight positive correlation between the proportion of Bhutanese and percentage of population receiving government assistance and/or food stamps in the United States with a correlation coefficient (R) of 0.076 and weighted average of 9.2%. Similarly, the statistical analysis conducted on geographies consisting of 87,412,076 people shows a slight negative correlation between the proportion of U.S. Virgin Islanders and percentage of population receiving government assistance and/or food stamps in the United States with a correlation coefficient (R) of -0.060 and weighted average of 16.5%, a difference of 79.4%.
Receiving Food Stamps Correlation Summary
| Measurement | Bhutanese | U.S. Virgin Islander |
| Minimum | 1.0% | 1.3% |
| Maximum | 32.4% | 37.5% |
| Range | 31.4% | 36.2% |
| Mean | 10.2% | 15.4% |
| Median | 8.8% | 15.1% |
| Interquartile 25% (IQ1) | 6.0% | 11.0% |
| Interquartile 75% (IQ3) | 12.0% | 18.8% |
| Interquartile Range (IQR) | 6.0% | 7.8% |
| Standard Deviation (Sample) | 6.3% | 7.1% |
| Standard Deviation (Population) | 6.3% | 7.1% |
Similar Demographics by Receiving Food Stamps
Demographics Similar to Bhutanese by Receiving Food Stamps
In terms of receiving food stamps, the demographic groups most similar to Bhutanese are Czech (9.2%, a difference of 0.010%), Swedish (9.2%, a difference of 0.24%), Immigrants from Lithuania (9.2%, a difference of 0.28%), Immigrants from Ireland (9.2%, a difference of 0.43%), and Immigrants from Northern Europe (9.2%, a difference of 0.54%).
| Demographics | Rating | Rank | Receiving Food Stamps |
| Latvians | 99.8 /100 | #20 | Exceptional 9.1% |
| Luxembourgers | 99.8 /100 | #21 | Exceptional 9.1% |
| Immigrants | Australia | 99.8 /100 | #22 | Exceptional 9.2% |
| Eastern Europeans | 99.8 /100 | #23 | Exceptional 9.2% |
| Immigrants | Northern Europe | 99.8 /100 | #24 | Exceptional 9.2% |
| Immigrants | Ireland | 99.8 /100 | #25 | Exceptional 9.2% |
| Swedes | 99.8 /100 | #26 | Exceptional 9.2% |
| Bhutanese | 99.8 /100 | #27 | Exceptional 9.2% |
| Czechs | 99.8 /100 | #28 | Exceptional 9.2% |
| Immigrants | Lithuania | 99.8 /100 | #29 | Exceptional 9.2% |
| Immigrants | Sweden | 99.7 /100 | #30 | Exceptional 9.3% |
| Immigrants | Eastern Asia | 99.7 /100 | #31 | Exceptional 9.3% |
| Bolivians | 99.7 /100 | #32 | Exceptional 9.3% |
| Zimbabweans | 99.6 /100 | #33 | Exceptional 9.5% |
| Turks | 99.6 /100 | #34 | Exceptional 9.5% |
Demographics Similar to U.S. Virgin Islanders by Receiving Food Stamps
In terms of receiving food stamps, the demographic groups most similar to U.S. Virgin Islanders are Barbadian (16.5%, a difference of 0.24%), Houma (16.5%, a difference of 0.50%), Immigrants from Barbados (16.6%, a difference of 0.56%), Jamaican (16.4%, a difference of 0.79%), and Immigrants from the Azores (16.4%, a difference of 0.86%).
| Demographics | Rating | Rank | Receiving Food Stamps |
| Immigrants | West Indies | 0.0 /100 | #302 | Tragic 16.1% |
| Nicaraguans | 0.0 /100 | #303 | Tragic 16.1% |
| West Indians | 0.0 /100 | #304 | Tragic 16.3% |
| Immigrants | Azores | 0.0 /100 | #305 | Tragic 16.4% |
| Jamaicans | 0.0 /100 | #306 | Tragic 16.4% |
| Houma | 0.0 /100 | #307 | Tragic 16.5% |
| Barbadians | 0.0 /100 | #308 | Tragic 16.5% |
| U.S. Virgin Islanders | 0.0 /100 | #309 | Tragic 16.5% |
| Immigrants | Barbados | 0.0 /100 | #310 | Tragic 16.6% |
| Guyanese | 0.0 /100 | #311 | Tragic 16.7% |
| Sioux | 0.0 /100 | #312 | Tragic 16.8% |
| Immigrants | Jamaica | 0.0 /100 | #313 | Tragic 16.9% |
| Immigrants | Guyana | 0.0 /100 | #314 | Tragic 16.9% |
| Bahamians | 0.0 /100 | #315 | Tragic 17.0% |
| Central American Indians | 0.0 /100 | #316 | Tragic 17.1% |