Immigrants from Zaire vs Hungarian Receiving Food Stamps
COMPARE
Immigrants from Zaire
Hungarian
Receiving Food Stamps
Receiving Food Stamps Comparison
Immigrants from Zaire
Hungarians
13.4%
RECEIVING FOOD STAMPS
1.9/ 100
METRIC RATING
235th/ 347
METRIC RANK
11.0%
RECEIVING FOOD STAMPS
85.1/ 100
METRIC RATING
145th/ 347
METRIC RANK
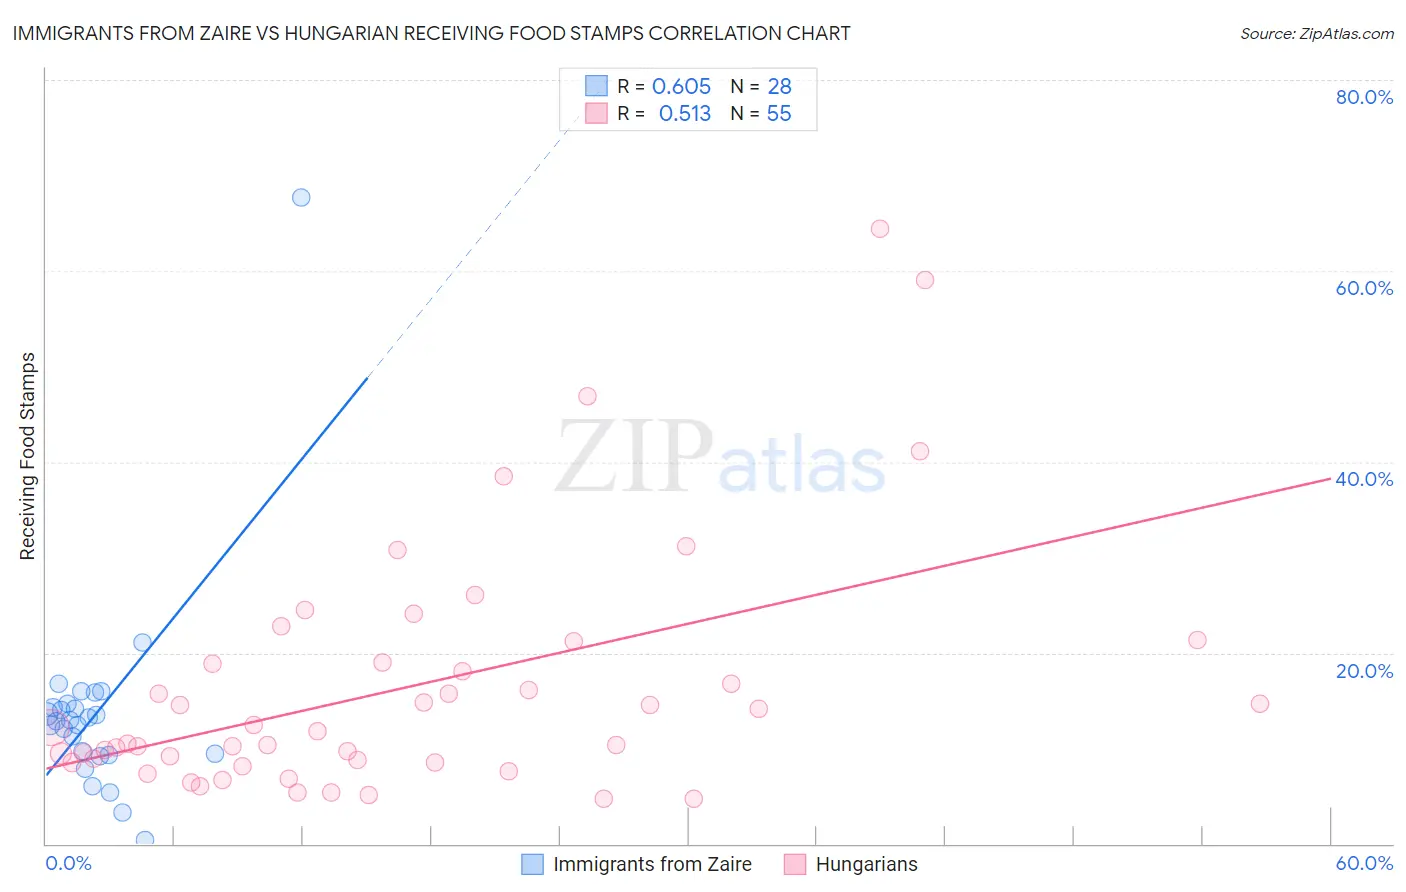
Immigrants from Zaire vs Hungarian Receiving Food Stamps Correlation Chart
The statistical analysis conducted on geographies consisting of 107,223,376 people shows a significant positive correlation between the proportion of Immigrants from Zaire and percentage of population receiving government assistance and/or food stamps in the United States with a correlation coefficient (R) of 0.605 and weighted average of 13.4%. Similarly, the statistical analysis conducted on geographies consisting of 483,983,942 people shows a substantial positive correlation between the proportion of Hungarians and percentage of population receiving government assistance and/or food stamps in the United States with a correlation coefficient (R) of 0.513 and weighted average of 11.0%, a difference of 21.2%.
Receiving Food Stamps Correlation Summary
| Measurement | Immigrants from Zaire | Hungarian |
| Minimum | 0.40% | 4.7% |
| Maximum | 67.7% | 64.4% |
| Range | 67.3% | 59.7% |
| Mean | 13.7% | 16.3% |
| Median | 12.9% | 11.7% |
| Interquartile 25% (IQ1) | 9.3% | 8.5% |
| Interquartile 75% (IQ3) | 14.5% | 19.0% |
| Interquartile Range (IQR) | 5.1% | 10.5% |
| Standard Deviation (Sample) | 11.4% | 12.9% |
| Standard Deviation (Population) | 11.2% | 12.7% |
Similar Demographics by Receiving Food Stamps
Demographics Similar to Immigrants from Zaire by Receiving Food Stamps
In terms of receiving food stamps, the demographic groups most similar to Immigrants from Zaire are Crow (13.4%, a difference of 0.44%), Immigrants from El Salvador (13.5%, a difference of 0.67%), Comanche (13.3%, a difference of 0.77%), French American Indian (13.5%, a difference of 0.87%), and Cherokee (13.2%, a difference of 0.90%).
| Demographics | Rating | Rank | Receiving Food Stamps |
| Panamanians | 3.5 /100 | #228 | Tragic 13.1% |
| Ottawa | 3.5 /100 | #229 | Tragic 13.1% |
| Puget Sound Salish | 3.4 /100 | #230 | Tragic 13.1% |
| Immigrants | Nigeria | 3.4 /100 | #231 | Tragic 13.1% |
| Salvadorans | 2.7 /100 | #232 | Tragic 13.2% |
| Cherokee | 2.5 /100 | #233 | Tragic 13.2% |
| Comanche | 2.4 /100 | #234 | Tragic 13.3% |
| Immigrants | Zaire | 1.9 /100 | #235 | Tragic 13.4% |
| Crow | 1.6 /100 | #236 | Tragic 13.4% |
| Immigrants | El Salvador | 1.5 /100 | #237 | Tragic 13.5% |
| French American Indians | 1.4 /100 | #238 | Tragic 13.5% |
| Immigrants | Micronesia | 1.3 /100 | #239 | Tragic 13.5% |
| Iroquois | 1.2 /100 | #240 | Tragic 13.5% |
| Choctaw | 1.0 /100 | #241 | Tragic 13.6% |
| Immigrants | Panama | 1.0 /100 | #242 | Tragic 13.6% |
Demographics Similar to Hungarians by Receiving Food Stamps
In terms of receiving food stamps, the demographic groups most similar to Hungarians are Syrian (11.0%, a difference of 0.12%), Taiwanese (11.0%, a difference of 0.24%), Immigrants from Northern Africa (11.0%, a difference of 0.27%), White/Caucasian (11.1%, a difference of 0.34%), and Chilean (11.0%, a difference of 0.35%).
| Demographics | Rating | Rank | Receiving Food Stamps |
| Immigrants | Moldova | 88.5 /100 | #138 | Excellent 10.9% |
| Hmong | 88.4 /100 | #139 | Excellent 10.9% |
| Celtics | 87.8 /100 | #140 | Excellent 10.9% |
| Immigrants | Vietnam | 86.7 /100 | #141 | Excellent 11.0% |
| Chileans | 86.2 /100 | #142 | Excellent 11.0% |
| Immigrants | Northern Africa | 86.0 /100 | #143 | Excellent 11.0% |
| Syrians | 85.5 /100 | #144 | Excellent 11.0% |
| Hungarians | 85.1 /100 | #145 | Excellent 11.0% |
| Taiwanese | 84.2 /100 | #146 | Excellent 11.0% |
| Whites/Caucasians | 83.9 /100 | #147 | Excellent 11.1% |
| Immigrants | South Eastern Asia | 83.3 /100 | #148 | Excellent 11.1% |
| Brazilians | 83.2 /100 | #149 | Excellent 11.1% |
| Soviet Union | 83.1 /100 | #150 | Excellent 11.1% |
| Immigrants | Spain | 81.7 /100 | #151 | Excellent 11.1% |
| Immigrants | Kazakhstan | 81.7 /100 | #152 | Excellent 11.1% |