Bhutanese vs Immigrants from Lebanon Receiving Food Stamps
COMPARE
Bhutanese
Immigrants from Lebanon
Receiving Food Stamps
Receiving Food Stamps Comparison
Bhutanese
Immigrants from Lebanon
9.2%
RECEIVING FOOD STAMPS
99.8/ 100
METRIC RATING
27th/ 347
METRIC RANK
11.3%
RECEIVING FOOD STAMPS
75.2/ 100
METRIC RATING
157th/ 347
METRIC RANK
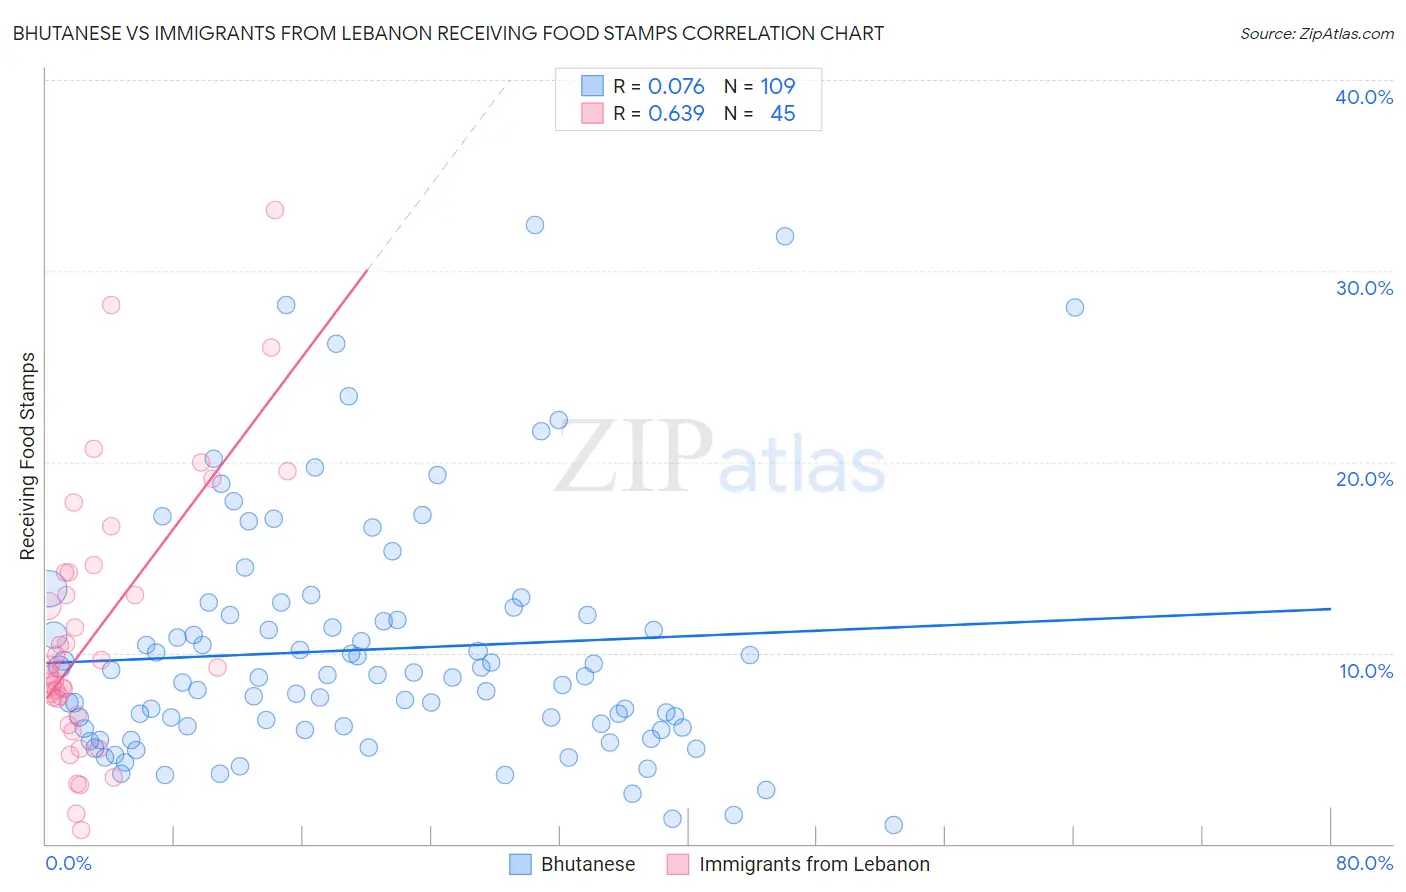
Bhutanese vs Immigrants from Lebanon Receiving Food Stamps Correlation Chart
The statistical analysis conducted on geographies consisting of 453,770,052 people shows a slight positive correlation between the proportion of Bhutanese and percentage of population receiving government assistance and/or food stamps in the United States with a correlation coefficient (R) of 0.076 and weighted average of 9.2%. Similarly, the statistical analysis conducted on geographies consisting of 216,755,093 people shows a significant positive correlation between the proportion of Immigrants from Lebanon and percentage of population receiving government assistance and/or food stamps in the United States with a correlation coefficient (R) of 0.639 and weighted average of 11.3%, a difference of 22.4%.
Receiving Food Stamps Correlation Summary
| Measurement | Bhutanese | Immigrants from Lebanon |
| Minimum | 1.0% | 0.70% |
| Maximum | 32.4% | 33.2% |
| Range | 31.4% | 32.5% |
| Mean | 10.2% | 11.1% |
| Median | 8.8% | 9.2% |
| Interquartile 25% (IQ1) | 6.0% | 7.2% |
| Interquartile 75% (IQ3) | 12.0% | 14.2% |
| Interquartile Range (IQR) | 6.0% | 7.0% |
| Standard Deviation (Sample) | 6.3% | 6.9% |
| Standard Deviation (Population) | 6.3% | 6.8% |
Similar Demographics by Receiving Food Stamps
Demographics Similar to Bhutanese by Receiving Food Stamps
In terms of receiving food stamps, the demographic groups most similar to Bhutanese are Czech (9.2%, a difference of 0.010%), Swedish (9.2%, a difference of 0.24%), Immigrants from Lithuania (9.2%, a difference of 0.28%), Immigrants from Ireland (9.2%, a difference of 0.43%), and Immigrants from Northern Europe (9.2%, a difference of 0.54%).
| Demographics | Rating | Rank | Receiving Food Stamps |
| Latvians | 99.8 /100 | #20 | Exceptional 9.1% |
| Luxembourgers | 99.8 /100 | #21 | Exceptional 9.1% |
| Immigrants | Australia | 99.8 /100 | #22 | Exceptional 9.2% |
| Eastern Europeans | 99.8 /100 | #23 | Exceptional 9.2% |
| Immigrants | Northern Europe | 99.8 /100 | #24 | Exceptional 9.2% |
| Immigrants | Ireland | 99.8 /100 | #25 | Exceptional 9.2% |
| Swedes | 99.8 /100 | #26 | Exceptional 9.2% |
| Bhutanese | 99.8 /100 | #27 | Exceptional 9.2% |
| Czechs | 99.8 /100 | #28 | Exceptional 9.2% |
| Immigrants | Lithuania | 99.8 /100 | #29 | Exceptional 9.2% |
| Immigrants | Sweden | 99.7 /100 | #30 | Exceptional 9.3% |
| Immigrants | Eastern Asia | 99.7 /100 | #31 | Exceptional 9.3% |
| Bolivians | 99.7 /100 | #32 | Exceptional 9.3% |
| Zimbabweans | 99.6 /100 | #33 | Exceptional 9.5% |
| Turks | 99.6 /100 | #34 | Exceptional 9.5% |
Demographics Similar to Immigrants from Lebanon by Receiving Food Stamps
In terms of receiving food stamps, the demographic groups most similar to Immigrants from Lebanon are Immigrants from Afghanistan (11.3%, a difference of 0.080%), Immigrants from Bosnia and Herzegovina (11.3%, a difference of 0.49%), Immigrants from Oceania (11.4%, a difference of 0.87%), French Canadian (11.4%, a difference of 1.0%), and Immigrants from Argentina (11.2%, a difference of 1.1%).
| Demographics | Rating | Rank | Receiving Food Stamps |
| Soviet Union | 83.1 /100 | #150 | Excellent 11.1% |
| Immigrants | Spain | 81.7 /100 | #151 | Excellent 11.1% |
| Immigrants | Kazakhstan | 81.7 /100 | #152 | Excellent 11.1% |
| Lebanese | 81.6 /100 | #153 | Excellent 11.1% |
| Armenians | 81.4 /100 | #154 | Excellent 11.1% |
| Immigrants | Argentina | 80.4 /100 | #155 | Excellent 11.2% |
| Immigrants | Afghanistan | 75.6 /100 | #156 | Good 11.3% |
| Immigrants | Lebanon | 75.2 /100 | #157 | Good 11.3% |
| Immigrants | Bosnia and Herzegovina | 72.6 /100 | #158 | Good 11.3% |
| Immigrants | Oceania | 70.4 /100 | #159 | Good 11.4% |
| French Canadians | 69.5 /100 | #160 | Good 11.4% |
| Pennsylvania Germans | 68.4 /100 | #161 | Good 11.4% |
| Alsatians | 68.0 /100 | #162 | Good 11.4% |
| Immigrants | Southern Europe | 65.8 /100 | #163 | Good 11.5% |
| Immigrants | Chile | 65.0 /100 | #164 | Good 11.5% |