Bhutanese vs Immigrants from Russia Receiving Food Stamps
COMPARE
Bhutanese
Immigrants from Russia
Receiving Food Stamps
Receiving Food Stamps Comparison
Bhutanese
Immigrants from Russia
9.2%
RECEIVING FOOD STAMPS
99.8/ 100
METRIC RATING
27th/ 347
METRIC RANK
10.8%
RECEIVING FOOD STAMPS
90.9/ 100
METRIC RATING
133rd/ 347
METRIC RANK
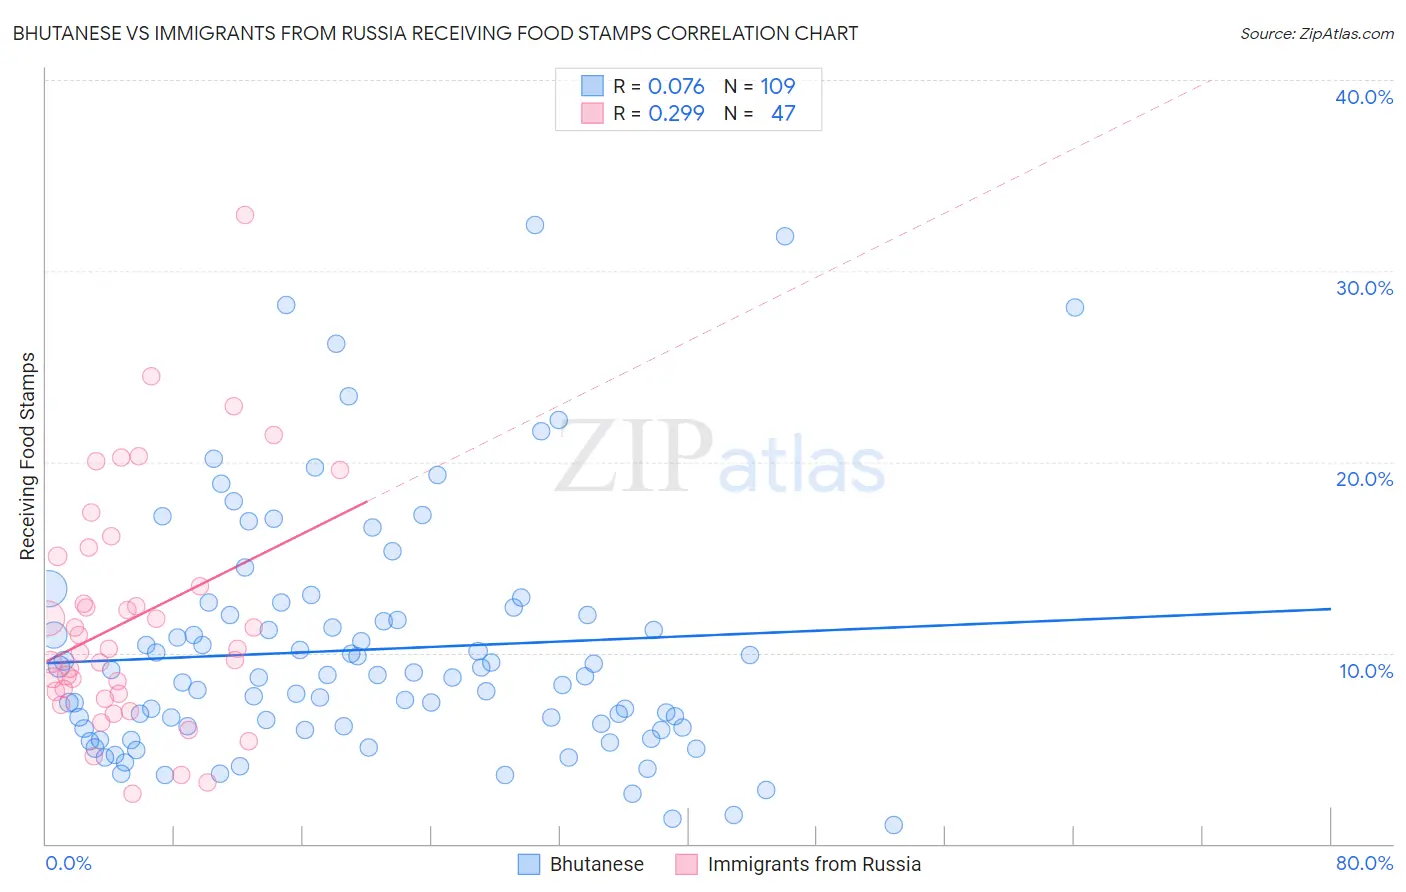
Bhutanese vs Immigrants from Russia Receiving Food Stamps Correlation Chart
The statistical analysis conducted on geographies consisting of 453,770,052 people shows a slight positive correlation between the proportion of Bhutanese and percentage of population receiving government assistance and/or food stamps in the United States with a correlation coefficient (R) of 0.076 and weighted average of 9.2%. Similarly, the statistical analysis conducted on geographies consisting of 346,828,802 people shows a weak positive correlation between the proportion of Immigrants from Russia and percentage of population receiving government assistance and/or food stamps in the United States with a correlation coefficient (R) of 0.299 and weighted average of 10.8%, a difference of 17.1%.
Receiving Food Stamps Correlation Summary
| Measurement | Bhutanese | Immigrants from Russia |
| Minimum | 1.0% | 2.6% |
| Maximum | 32.4% | 32.9% |
| Range | 31.4% | 30.3% |
| Mean | 10.2% | 11.8% |
| Median | 8.8% | 10.2% |
| Interquartile 25% (IQ1) | 6.0% | 7.8% |
| Interquartile 75% (IQ3) | 12.0% | 15.1% |
| Interquartile Range (IQR) | 6.0% | 7.2% |
| Standard Deviation (Sample) | 6.3% | 6.2% |
| Standard Deviation (Population) | 6.3% | 6.1% |
Similar Demographics by Receiving Food Stamps
Demographics Similar to Bhutanese by Receiving Food Stamps
In terms of receiving food stamps, the demographic groups most similar to Bhutanese are Czech (9.2%, a difference of 0.010%), Swedish (9.2%, a difference of 0.24%), Immigrants from Lithuania (9.2%, a difference of 0.28%), Immigrants from Ireland (9.2%, a difference of 0.43%), and Immigrants from Northern Europe (9.2%, a difference of 0.54%).
| Demographics | Rating | Rank | Receiving Food Stamps |
| Latvians | 99.8 /100 | #20 | Exceptional 9.1% |
| Luxembourgers | 99.8 /100 | #21 | Exceptional 9.1% |
| Immigrants | Australia | 99.8 /100 | #22 | Exceptional 9.2% |
| Eastern Europeans | 99.8 /100 | #23 | Exceptional 9.2% |
| Immigrants | Northern Europe | 99.8 /100 | #24 | Exceptional 9.2% |
| Immigrants | Ireland | 99.8 /100 | #25 | Exceptional 9.2% |
| Swedes | 99.8 /100 | #26 | Exceptional 9.2% |
| Bhutanese | 99.8 /100 | #27 | Exceptional 9.2% |
| Czechs | 99.8 /100 | #28 | Exceptional 9.2% |
| Immigrants | Lithuania | 99.8 /100 | #29 | Exceptional 9.2% |
| Immigrants | Sweden | 99.7 /100 | #30 | Exceptional 9.3% |
| Immigrants | Eastern Asia | 99.7 /100 | #31 | Exceptional 9.3% |
| Bolivians | 99.7 /100 | #32 | Exceptional 9.3% |
| Zimbabweans | 99.6 /100 | #33 | Exceptional 9.5% |
| Turks | 99.6 /100 | #34 | Exceptional 9.5% |
Demographics Similar to Immigrants from Russia by Receiving Food Stamps
In terms of receiving food stamps, the demographic groups most similar to Immigrants from Russia are Immigrants from Brazil (10.8%, a difference of 0.30%), Argentinean (10.8%, a difference of 0.32%), Slovak (10.8%, a difference of 0.49%), Immigrants from Germany (10.7%, a difference of 0.50%), and Immigrants from Eastern Europe (10.8%, a difference of 0.51%).
| Demographics | Rating | Rank | Receiving Food Stamps |
| Afghans | 92.6 /100 | #126 | Exceptional 10.7% |
| Immigrants | Ethiopia | 92.6 /100 | #127 | Exceptional 10.7% |
| Immigrants | Jordan | 92.5 /100 | #128 | Exceptional 10.7% |
| Yugoslavians | 92.5 /100 | #129 | Exceptional 10.7% |
| Israelis | 92.4 /100 | #130 | Exceptional 10.7% |
| French | 92.3 /100 | #131 | Exceptional 10.7% |
| Immigrants | Germany | 92.0 /100 | #132 | Exceptional 10.7% |
| Immigrants | Russia | 90.9 /100 | #133 | Exceptional 10.8% |
| Immigrants | Brazil | 90.3 /100 | #134 | Exceptional 10.8% |
| Argentineans | 90.2 /100 | #135 | Exceptional 10.8% |
| Slovaks | 89.8 /100 | #136 | Excellent 10.8% |
| Immigrants | Eastern Europe | 89.8 /100 | #137 | Excellent 10.8% |
| Immigrants | Moldova | 88.5 /100 | #138 | Excellent 10.9% |
| Hmong | 88.4 /100 | #139 | Excellent 10.9% |
| Celtics | 87.8 /100 | #140 | Excellent 10.9% |