Bhutanese vs Immigrants from Nicaragua Single Mother Poverty
COMPARE
Bhutanese
Immigrants from Nicaragua
Single Mother Poverty
Single Mother Poverty Comparison
Bhutanese
Immigrants from Nicaragua
25.6%
SINGLE MOTHER POVERTY
100.0/ 100
METRIC RATING
12th/ 347
METRIC RANK
30.3%
SINGLE MOTHER POVERTY
3.5/ 100
METRIC RATING
234th/ 347
METRIC RANK
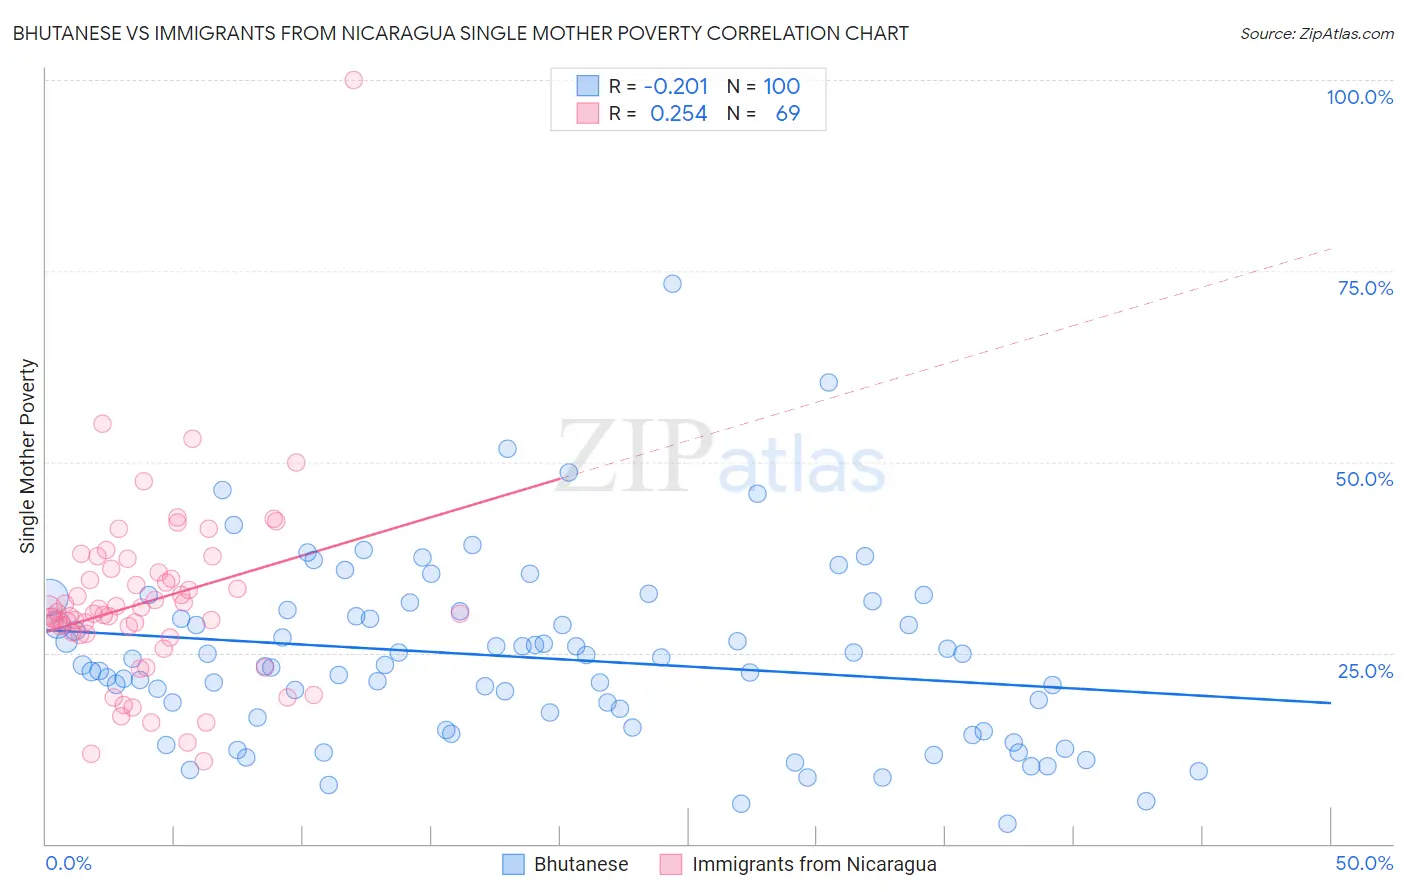
Bhutanese vs Immigrants from Nicaragua Single Mother Poverty Correlation Chart
The statistical analysis conducted on geographies consisting of 442,258,638 people shows a weak negative correlation between the proportion of Bhutanese and poverty level among single mothers in the United States with a correlation coefficient (R) of -0.201 and weighted average of 25.6%. Similarly, the statistical analysis conducted on geographies consisting of 234,135,919 people shows a weak positive correlation between the proportion of Immigrants from Nicaragua and poverty level among single mothers in the United States with a correlation coefficient (R) of 0.254 and weighted average of 30.3%, a difference of 18.4%.
Single Mother Poverty Correlation Summary
| Measurement | Bhutanese | Immigrants from Nicaragua |
| Minimum | 2.6% | 10.8% |
| Maximum | 73.4% | 100.0% |
| Range | 70.8% | 89.2% |
| Mean | 24.4% | 31.7% |
| Median | 23.4% | 30.2% |
| Interquartile 25% (IQ1) | 15.9% | 27.4% |
| Interquartile 75% (IQ3) | 30.2% | 35.7% |
| Interquartile Range (IQR) | 14.3% | 8.3% |
| Standard Deviation (Sample) | 11.8% | 12.3% |
| Standard Deviation (Population) | 11.8% | 12.2% |
Similar Demographics by Single Mother Poverty
Demographics Similar to Bhutanese by Single Mother Poverty
In terms of single mother poverty, the demographic groups most similar to Bhutanese are Iranian (25.5%, a difference of 0.37%), Indian (Asian) (25.8%, a difference of 0.52%), Immigrants from Singapore (25.8%, a difference of 0.67%), Immigrants from Ireland (25.8%, a difference of 0.86%), and Bolivian (25.9%, a difference of 1.1%).
| Demographics | Rating | Rank | Single Mother Poverty |
| Immigrants | Hong Kong | 100.0 /100 | #5 | Exceptional 24.4% |
| Thais | 100.0 /100 | #6 | Exceptional 24.5% |
| Chinese | 100.0 /100 | #7 | Exceptional 24.6% |
| Immigrants | Iran | 100.0 /100 | #8 | Exceptional 25.1% |
| Immigrants | Lithuania | 100.0 /100 | #9 | Exceptional 25.2% |
| Immigrants | South Central Asia | 100.0 /100 | #10 | Exceptional 25.3% |
| Iranians | 100.0 /100 | #11 | Exceptional 25.5% |
| Bhutanese | 100.0 /100 | #12 | Exceptional 25.6% |
| Indians (Asian) | 100.0 /100 | #13 | Exceptional 25.8% |
| Immigrants | Singapore | 100.0 /100 | #14 | Exceptional 25.8% |
| Immigrants | Ireland | 100.0 /100 | #15 | Exceptional 25.8% |
| Bolivians | 100.0 /100 | #16 | Exceptional 25.9% |
| Asians | 100.0 /100 | #17 | Exceptional 26.0% |
| Immigrants | Pakistan | 100.0 /100 | #18 | Exceptional 26.0% |
| Immigrants | Eastern Asia | 100.0 /100 | #19 | Exceptional 26.1% |
Demographics Similar to Immigrants from Nicaragua by Single Mother Poverty
In terms of single mother poverty, the demographic groups most similar to Immigrants from Nicaragua are Immigrants from Middle Africa (30.3%, a difference of 0.0%), Immigrants from Grenada (30.3%, a difference of 0.030%), Welsh (30.4%, a difference of 0.10%), Immigrants from St. Vincent and the Grenadines (30.4%, a difference of 0.14%), and Alaskan Athabascan (30.3%, a difference of 0.22%).
| Demographics | Rating | Rank | Single Mother Poverty |
| Immigrants | Liberia | 5.9 /100 | #227 | Tragic 30.1% |
| Spaniards | 5.4 /100 | #228 | Tragic 30.2% |
| Immigrants | Barbados | 5.0 /100 | #229 | Tragic 30.2% |
| English | 4.8 /100 | #230 | Tragic 30.2% |
| Dutch | 4.3 /100 | #231 | Tragic 30.2% |
| Alaskan Athabascans | 4.1 /100 | #232 | Tragic 30.3% |
| Immigrants | Middle Africa | 3.5 /100 | #233 | Tragic 30.3% |
| Immigrants | Nicaragua | 3.5 /100 | #234 | Tragic 30.3% |
| Immigrants | Grenada | 3.4 /100 | #235 | Tragic 30.3% |
| Welsh | 3.2 /100 | #236 | Tragic 30.4% |
| Immigrants | St. Vincent and the Grenadines | 3.1 /100 | #237 | Tragic 30.4% |
| Slovaks | 2.8 /100 | #238 | Tragic 30.4% |
| Immigrants | Portugal | 2.1 /100 | #239 | Tragic 30.5% |
| Salvadorans | 1.8 /100 | #240 | Tragic 30.6% |
| Immigrants | Laos | 1.8 /100 | #241 | Tragic 30.6% |