Bhutanese vs Israeli Single Mother Poverty
COMPARE
Bhutanese
Israeli
Single Mother Poverty
Single Mother Poverty Comparison
Bhutanese
Israelis
25.6%
SINGLE MOTHER POVERTY
100.0/ 100
METRIC RATING
12th/ 347
METRIC RANK
28.0%
SINGLE MOTHER POVERTY
96.5/ 100
METRIC RATING
105th/ 347
METRIC RANK
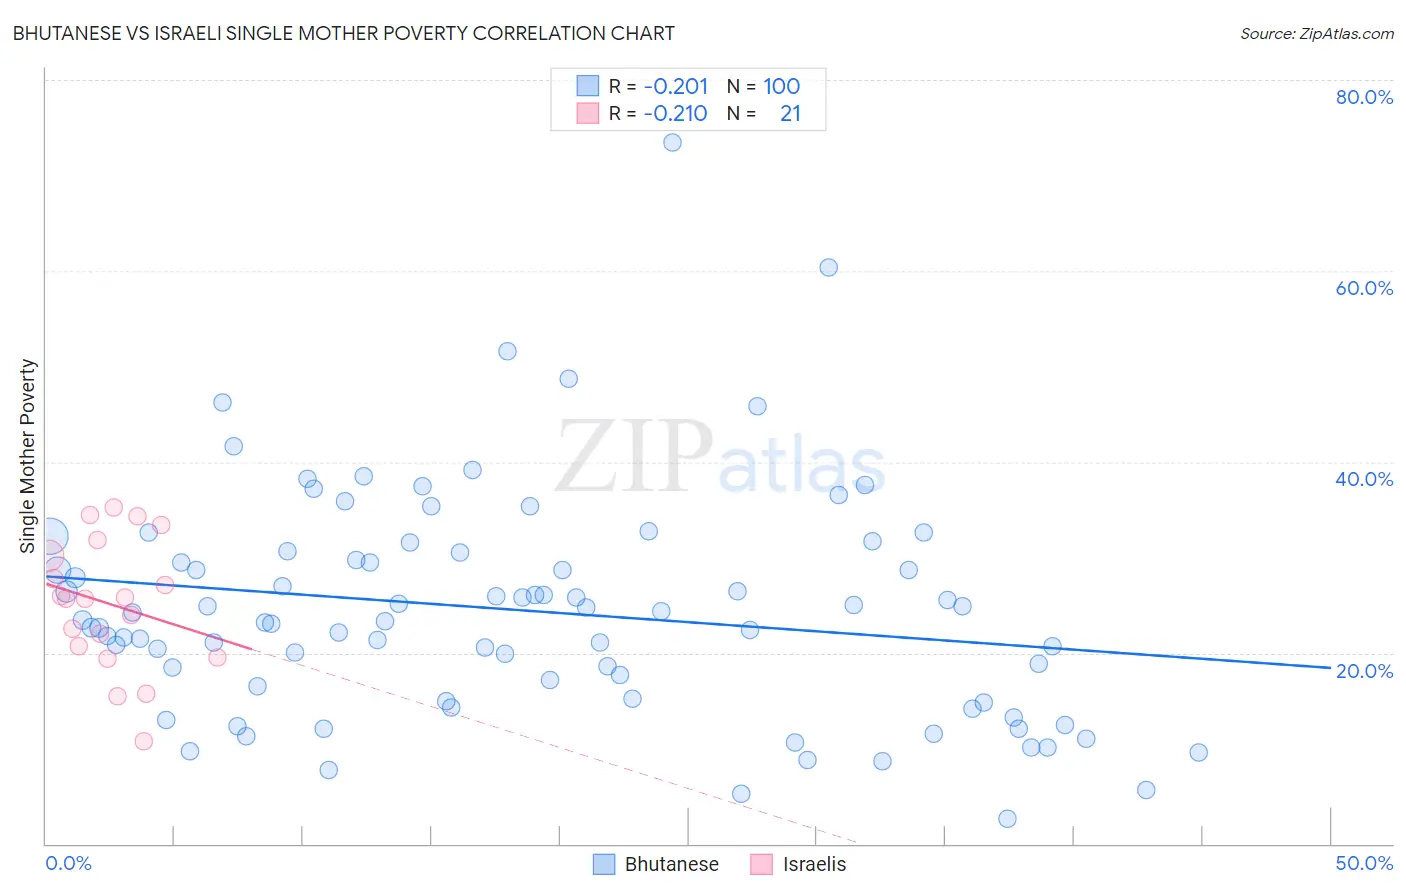
Bhutanese vs Israeli Single Mother Poverty Correlation Chart
The statistical analysis conducted on geographies consisting of 442,258,638 people shows a weak negative correlation between the proportion of Bhutanese and poverty level among single mothers in the United States with a correlation coefficient (R) of -0.201 and weighted average of 25.6%. Similarly, the statistical analysis conducted on geographies consisting of 207,028,427 people shows a weak negative correlation between the proportion of Israelis and poverty level among single mothers in the United States with a correlation coefficient (R) of -0.210 and weighted average of 28.0%, a difference of 9.3%.
Single Mother Poverty Correlation Summary
| Measurement | Bhutanese | Israeli |
| Minimum | 2.6% | 10.8% |
| Maximum | 73.4% | 35.2% |
| Range | 70.8% | 24.4% |
| Mean | 24.4% | 25.1% |
| Median | 23.4% | 25.6% |
| Interquartile 25% (IQ1) | 15.9% | 20.1% |
| Interquartile 75% (IQ3) | 30.2% | 31.0% |
| Interquartile Range (IQR) | 14.3% | 10.9% |
| Standard Deviation (Sample) | 11.8% | 6.8% |
| Standard Deviation (Population) | 11.8% | 6.6% |
Similar Demographics by Single Mother Poverty
Demographics Similar to Bhutanese by Single Mother Poverty
In terms of single mother poverty, the demographic groups most similar to Bhutanese are Iranian (25.5%, a difference of 0.37%), Indian (Asian) (25.8%, a difference of 0.52%), Immigrants from Singapore (25.8%, a difference of 0.67%), Immigrants from Ireland (25.8%, a difference of 0.86%), and Bolivian (25.9%, a difference of 1.1%).
| Demographics | Rating | Rank | Single Mother Poverty |
| Immigrants | Hong Kong | 100.0 /100 | #5 | Exceptional 24.4% |
| Thais | 100.0 /100 | #6 | Exceptional 24.5% |
| Chinese | 100.0 /100 | #7 | Exceptional 24.6% |
| Immigrants | Iran | 100.0 /100 | #8 | Exceptional 25.1% |
| Immigrants | Lithuania | 100.0 /100 | #9 | Exceptional 25.2% |
| Immigrants | South Central Asia | 100.0 /100 | #10 | Exceptional 25.3% |
| Iranians | 100.0 /100 | #11 | Exceptional 25.5% |
| Bhutanese | 100.0 /100 | #12 | Exceptional 25.6% |
| Indians (Asian) | 100.0 /100 | #13 | Exceptional 25.8% |
| Immigrants | Singapore | 100.0 /100 | #14 | Exceptional 25.8% |
| Immigrants | Ireland | 100.0 /100 | #15 | Exceptional 25.8% |
| Bolivians | 100.0 /100 | #16 | Exceptional 25.9% |
| Asians | 100.0 /100 | #17 | Exceptional 26.0% |
| Immigrants | Pakistan | 100.0 /100 | #18 | Exceptional 26.0% |
| Immigrants | Eastern Asia | 100.0 /100 | #19 | Exceptional 26.1% |
Demographics Similar to Israelis by Single Mother Poverty
In terms of single mother poverty, the demographic groups most similar to Israelis are Italian (28.0%, a difference of 0.020%), Immigrants from Northern Africa (28.0%, a difference of 0.040%), Ukrainian (28.0%, a difference of 0.040%), Immigrants from Croatia (28.0%, a difference of 0.060%), and Pakistani (28.0%, a difference of 0.16%).
| Demographics | Rating | Rank | Single Mother Poverty |
| Immigrants | Nepal | 97.2 /100 | #98 | Exceptional 27.9% |
| Immigrants | Netherlands | 97.2 /100 | #99 | Exceptional 27.9% |
| Zimbabweans | 97.1 /100 | #100 | Exceptional 27.9% |
| Pakistanis | 96.9 /100 | #101 | Exceptional 28.0% |
| Immigrants | Croatia | 96.7 /100 | #102 | Exceptional 28.0% |
| Immigrants | Northern Africa | 96.6 /100 | #103 | Exceptional 28.0% |
| Italians | 96.6 /100 | #104 | Exceptional 28.0% |
| Israelis | 96.5 /100 | #105 | Exceptional 28.0% |
| Ukrainians | 96.4 /100 | #106 | Exceptional 28.0% |
| Immigrants | Venezuela | 95.8 /100 | #107 | Exceptional 28.1% |
| Immigrants | Zimbabwe | 95.5 /100 | #108 | Exceptional 28.1% |
| Immigrants | Armenia | 95.2 /100 | #109 | Exceptional 28.1% |
| Croatians | 94.8 /100 | #110 | Exceptional 28.2% |
| Venezuelans | 94.5 /100 | #111 | Exceptional 28.2% |
| Immigrants | Kazakhstan | 94.5 /100 | #112 | Exceptional 28.2% |