Bhutanese vs Burmese Householder Income Ages 45 - 64 years
COMPARE
Bhutanese
Burmese
Householder Income Ages 45 - 64 years
Householder Income Ages 45 - 64 years Comparison
Bhutanese
Burmese
$117,750
HOUSEHOLDER INCOME AGES 45 - 64 YEARS
100.0/ 100
METRIC RATING
29th/ 347
METRIC RANK
$121,444
HOUSEHOLDER INCOME AGES 45 - 64 YEARS
100.0/ 100
METRIC RATING
17th/ 347
METRIC RANK
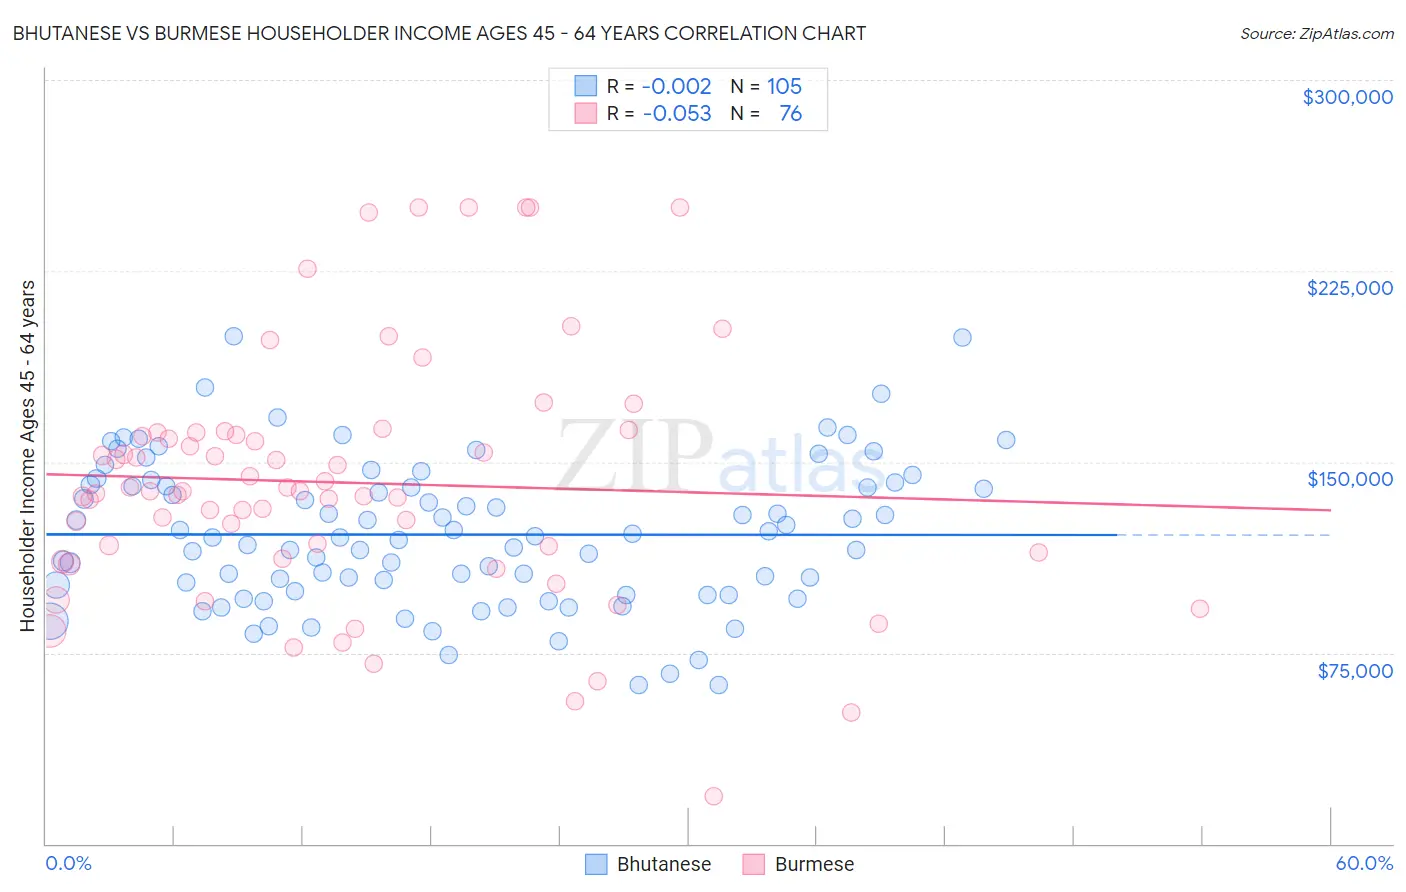
Bhutanese vs Burmese Householder Income Ages 45 - 64 years Correlation Chart
The statistical analysis conducted on geographies consisting of 454,365,624 people shows no correlation between the proportion of Bhutanese and household income with householder between the ages 45 and 64 in the United States with a correlation coefficient (R) of -0.002 and weighted average of $117,750. Similarly, the statistical analysis conducted on geographies consisting of 464,084,220 people shows a slight negative correlation between the proportion of Burmese and household income with householder between the ages 45 and 64 in the United States with a correlation coefficient (R) of -0.053 and weighted average of $121,444, a difference of 3.1%.
Householder Income Ages 45 - 64 years Correlation Summary
| Measurement | Bhutanese | Burmese |
| Minimum | $62,115 | $18,640 |
| Maximum | $199,389 | $250,001 |
| Range | $137,274 | $231,361 |
| Mean | $121,425 | $141,791 |
| Median | $120,522 | $138,461 |
| Interquartile 25% (IQ1) | $98,623 | $113,099 |
| Interquartile 75% (IQ3) | $140,769 | $160,979 |
| Interquartile Range (IQR) | $42,146 | $47,880 |
| Standard Deviation (Sample) | $28,538 | $48,701 |
| Standard Deviation (Population) | $28,402 | $48,379 |
Demographics Similar to Bhutanese and Burmese by Householder Income Ages 45 - 64 years
In terms of householder income ages 45 - 64 years, the demographic groups most similar to Bhutanese are Immigrants from Bolivia ($117,731, a difference of 0.020%), Turkish ($117,814, a difference of 0.050%), Immigrants from Northern Europe ($117,930, a difference of 0.15%), Immigrants from Sweden ($118,318, a difference of 0.48%), and Asian ($118,426, a difference of 0.57%). Similarly, the demographic groups most similar to Burmese are Immigrants from Korea ($121,243, a difference of 0.17%), Immigrants from China ($122,178, a difference of 0.60%), Eastern European ($120,684, a difference of 0.63%), Immigrants from Eastern Asia ($122,222, a difference of 0.64%), and Indian (Asian) ($122,343, a difference of 0.74%).
| Demographics | Rating | Rank | Householder Income Ages 45 - 64 years |
| Immigrants | Ireland | 100.0 /100 | #13 | Exceptional $122,757 |
| Indians (Asian) | 100.0 /100 | #14 | Exceptional $122,343 |
| Immigrants | Eastern Asia | 100.0 /100 | #15 | Exceptional $122,222 |
| Immigrants | China | 100.0 /100 | #16 | Exceptional $122,178 |
| Burmese | 100.0 /100 | #17 | Exceptional $121,444 |
| Immigrants | Korea | 100.0 /100 | #18 | Exceptional $121,243 |
| Eastern Europeans | 100.0 /100 | #19 | Exceptional $120,684 |
| Immigrants | Australia | 100.0 /100 | #20 | Exceptional $119,308 |
| Immigrants | Sri Lanka | 100.0 /100 | #21 | Exceptional $119,094 |
| Immigrants | Belgium | 100.0 /100 | #22 | Exceptional $118,932 |
| Bolivians | 100.0 /100 | #23 | Exceptional $118,871 |
| Immigrants | Japan | 100.0 /100 | #24 | Exceptional $118,498 |
| Asians | 100.0 /100 | #25 | Exceptional $118,426 |
| Immigrants | Sweden | 100.0 /100 | #26 | Exceptional $118,318 |
| Immigrants | Northern Europe | 100.0 /100 | #27 | Exceptional $117,930 |
| Turks | 100.0 /100 | #28 | Exceptional $117,814 |
| Bhutanese | 100.0 /100 | #29 | Exceptional $117,750 |
| Immigrants | Bolivia | 100.0 /100 | #30 | Exceptional $117,731 |
| Immigrants | Asia | 100.0 /100 | #31 | Exceptional $116,566 |
| Russians | 100.0 /100 | #32 | Exceptional $116,328 |
| Chinese | 100.0 /100 | #33 | Exceptional $116,156 |