Bhutanese vs Eastern European Single Mother Poverty
COMPARE
Bhutanese
Eastern European
Single Mother Poverty
Single Mother Poverty Comparison
Bhutanese
Eastern Europeans
25.6%
SINGLE MOTHER POVERTY
100.0/ 100
METRIC RATING
12th/ 347
METRIC RANK
27.2%
SINGLE MOTHER POVERTY
99.6/ 100
METRIC RATING
60th/ 347
METRIC RANK
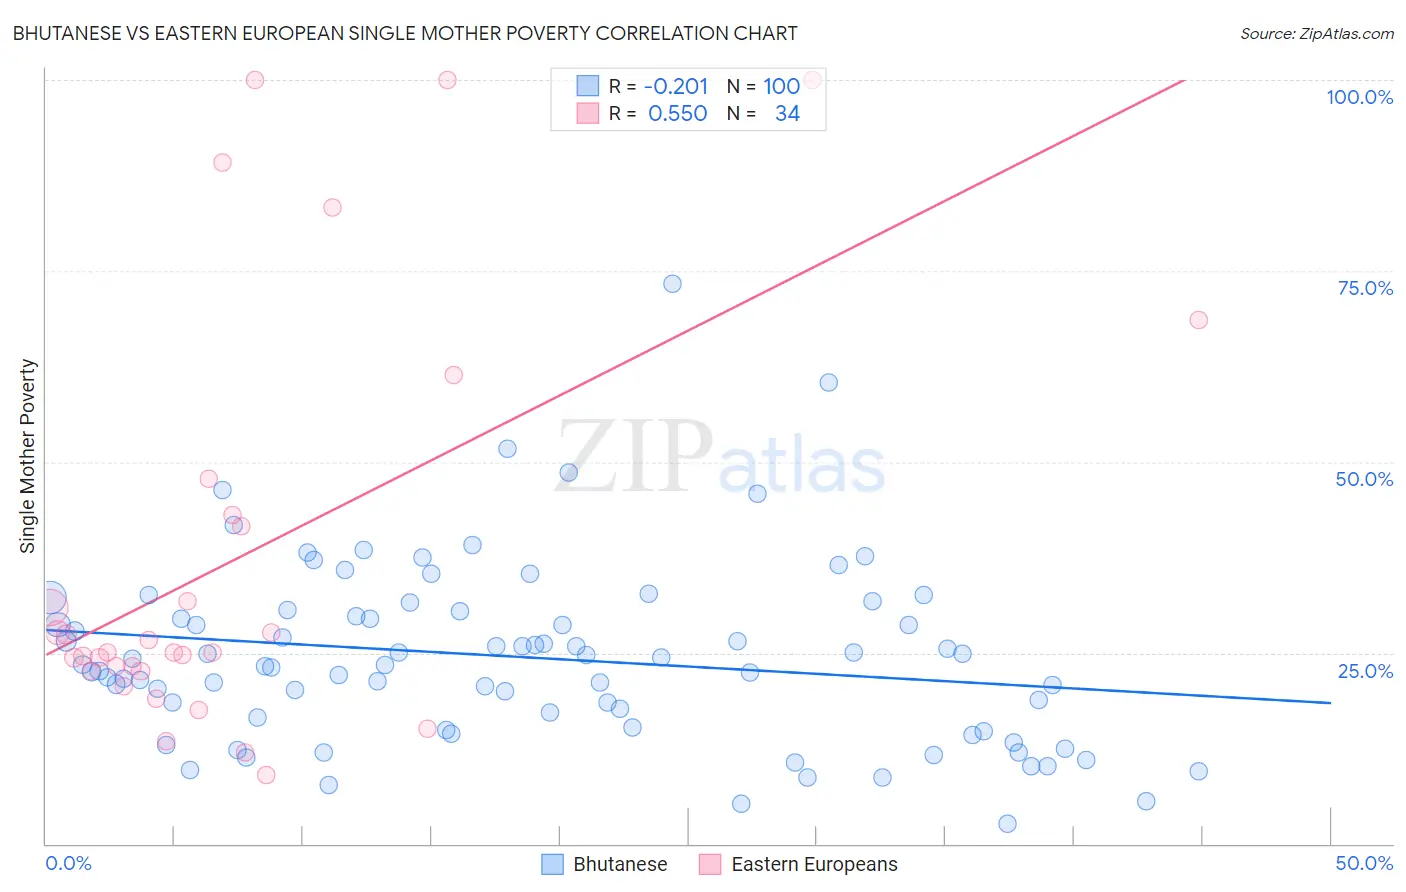
Bhutanese vs Eastern European Single Mother Poverty Correlation Chart
The statistical analysis conducted on geographies consisting of 442,258,638 people shows a weak negative correlation between the proportion of Bhutanese and poverty level among single mothers in the United States with a correlation coefficient (R) of -0.201 and weighted average of 25.6%. Similarly, the statistical analysis conducted on geographies consisting of 444,414,902 people shows a substantial positive correlation between the proportion of Eastern Europeans and poverty level among single mothers in the United States with a correlation coefficient (R) of 0.550 and weighted average of 27.2%, a difference of 6.2%.
Single Mother Poverty Correlation Summary
| Measurement | Bhutanese | Eastern European |
| Minimum | 2.6% | 9.0% |
| Maximum | 73.4% | 100.0% |
| Range | 70.8% | 91.0% |
| Mean | 24.4% | 37.6% |
| Median | 23.4% | 25.1% |
| Interquartile 25% (IQ1) | 15.9% | 22.7% |
| Interquartile 75% (IQ3) | 30.2% | 43.0% |
| Interquartile Range (IQR) | 14.3% | 20.3% |
| Standard Deviation (Sample) | 11.8% | 27.1% |
| Standard Deviation (Population) | 11.8% | 26.7% |
Similar Demographics by Single Mother Poverty
Demographics Similar to Bhutanese by Single Mother Poverty
In terms of single mother poverty, the demographic groups most similar to Bhutanese are Iranian (25.5%, a difference of 0.37%), Indian (Asian) (25.8%, a difference of 0.52%), Immigrants from Singapore (25.8%, a difference of 0.67%), Immigrants from Ireland (25.8%, a difference of 0.86%), and Bolivian (25.9%, a difference of 1.1%).
| Demographics | Rating | Rank | Single Mother Poverty |
| Immigrants | Hong Kong | 100.0 /100 | #5 | Exceptional 24.4% |
| Thais | 100.0 /100 | #6 | Exceptional 24.5% |
| Chinese | 100.0 /100 | #7 | Exceptional 24.6% |
| Immigrants | Iran | 100.0 /100 | #8 | Exceptional 25.1% |
| Immigrants | Lithuania | 100.0 /100 | #9 | Exceptional 25.2% |
| Immigrants | South Central Asia | 100.0 /100 | #10 | Exceptional 25.3% |
| Iranians | 100.0 /100 | #11 | Exceptional 25.5% |
| Bhutanese | 100.0 /100 | #12 | Exceptional 25.6% |
| Indians (Asian) | 100.0 /100 | #13 | Exceptional 25.8% |
| Immigrants | Singapore | 100.0 /100 | #14 | Exceptional 25.8% |
| Immigrants | Ireland | 100.0 /100 | #15 | Exceptional 25.8% |
| Bolivians | 100.0 /100 | #16 | Exceptional 25.9% |
| Asians | 100.0 /100 | #17 | Exceptional 26.0% |
| Immigrants | Pakistan | 100.0 /100 | #18 | Exceptional 26.0% |
| Immigrants | Eastern Asia | 100.0 /100 | #19 | Exceptional 26.1% |
Demographics Similar to Eastern Europeans by Single Mother Poverty
In terms of single mother poverty, the demographic groups most similar to Eastern Europeans are Paraguayan (27.2%, a difference of 0.040%), Argentinean (27.2%, a difference of 0.050%), Immigrants from Eastern Europe (27.2%, a difference of 0.11%), Palestinian (27.2%, a difference of 0.21%), and Immigrants from Romania (27.2%, a difference of 0.23%).
| Demographics | Rating | Rank | Single Mother Poverty |
| Immigrants | Jordan | 99.7 /100 | #53 | Exceptional 27.1% |
| Immigrants | Bulgaria | 99.7 /100 | #54 | Exceptional 27.1% |
| Immigrants | Egypt | 99.7 /100 | #55 | Exceptional 27.1% |
| Immigrants | Romania | 99.7 /100 | #56 | Exceptional 27.2% |
| Palestinians | 99.7 /100 | #57 | Exceptional 27.2% |
| Argentineans | 99.6 /100 | #58 | Exceptional 27.2% |
| Paraguayans | 99.6 /100 | #59 | Exceptional 27.2% |
| Eastern Europeans | 99.6 /100 | #60 | Exceptional 27.2% |
| Immigrants | Eastern Europe | 99.6 /100 | #61 | Exceptional 27.2% |
| Immigrants | Malaysia | 99.5 /100 | #62 | Exceptional 27.3% |
| Immigrants | Northern Europe | 99.5 /100 | #63 | Exceptional 27.3% |
| Russians | 99.5 /100 | #64 | Exceptional 27.3% |
| Immigrants | Turkey | 99.5 /100 | #65 | Exceptional 27.3% |
| Soviet Union | 99.5 /100 | #66 | Exceptional 27.3% |
| Immigrants | Australia | 99.5 /100 | #67 | Exceptional 27.3% |