Bermudan vs Immigrants from Sudan Master's Degree
COMPARE
Bermudan
Immigrants from Sudan
Master's Degree
Master's Degree Comparison
Bermudans
Immigrants from Sudan
15.4%
MASTER'S DEGREE
73.9/ 100
METRIC RATING
156th/ 347
METRIC RANK
16.0%
MASTER'S DEGREE
90.2/ 100
METRIC RATING
133rd/ 347
METRIC RANK
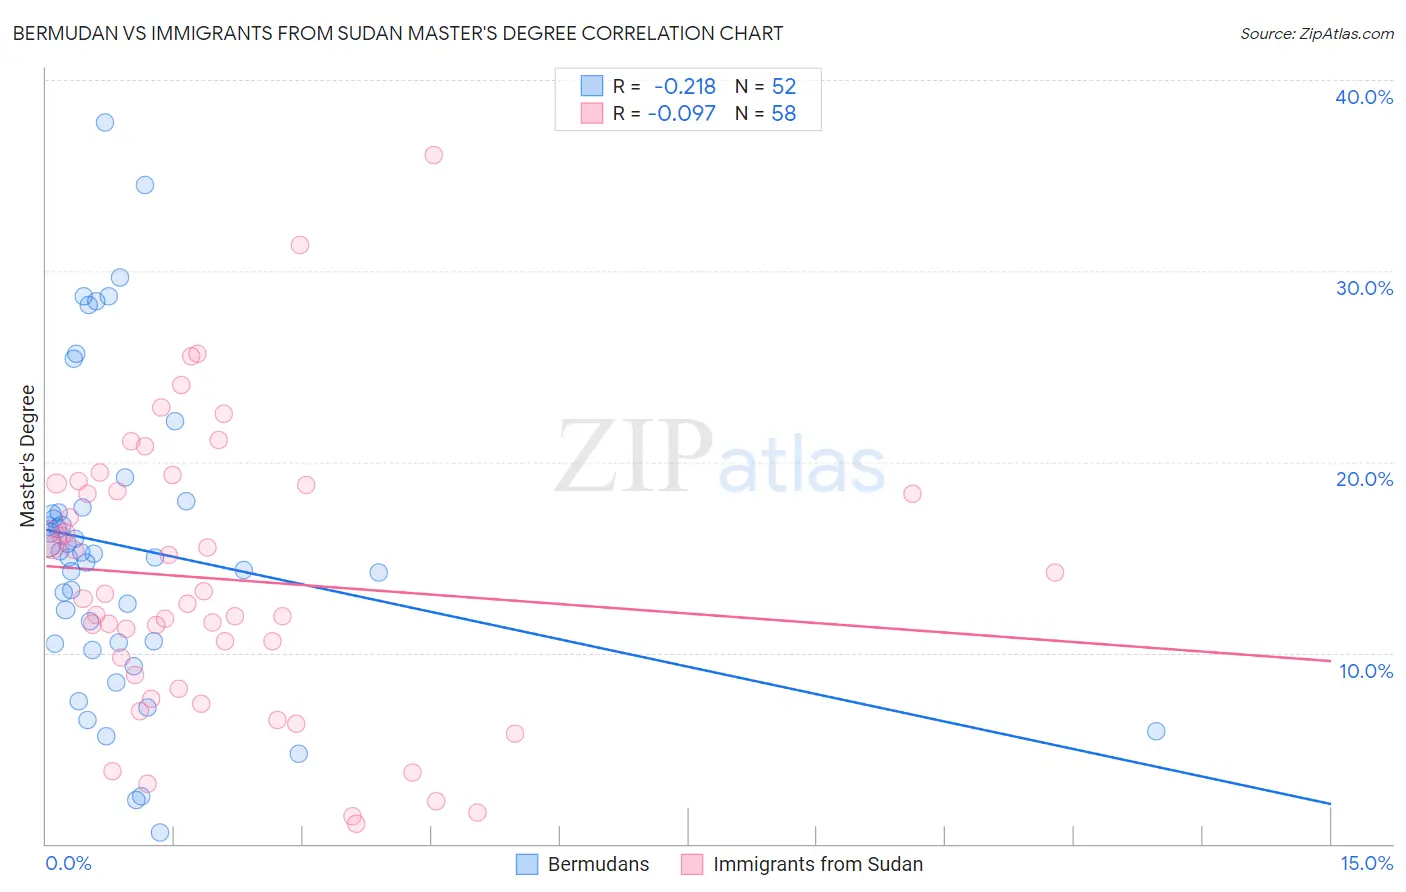
Bermudan vs Immigrants from Sudan Master's Degree Correlation Chart
The statistical analysis conducted on geographies consisting of 55,727,694 people shows a weak negative correlation between the proportion of Bermudans and percentage of population with at least master's degree education in the United States with a correlation coefficient (R) of -0.218 and weighted average of 15.4%. Similarly, the statistical analysis conducted on geographies consisting of 118,960,679 people shows a slight negative correlation between the proportion of Immigrants from Sudan and percentage of population with at least master's degree education in the United States with a correlation coefficient (R) of -0.097 and weighted average of 16.0%, a difference of 3.6%.
Master's Degree Correlation Summary
| Measurement | Bermudan | Immigrants from Sudan |
| Minimum | 0.60% | 1.0% |
| Maximum | 37.8% | 36.1% |
| Range | 37.2% | 35.0% |
| Mean | 15.5% | 13.9% |
| Median | 15.1% | 13.0% |
| Interquartile 25% (IQ1) | 10.5% | 8.8% |
| Interquartile 75% (IQ3) | 17.5% | 18.8% |
| Interquartile Range (IQR) | 7.0% | 10.0% |
| Standard Deviation (Sample) | 8.1% | 7.4% |
| Standard Deviation (Population) | 8.0% | 7.3% |
Similar Demographics by Master's Degree
Demographics Similar to Bermudans by Master's Degree
In terms of master's degree, the demographic groups most similar to Bermudans are Immigrants from Cameroon (15.4%, a difference of 0.35%), Immigrants from Bangladesh (15.5%, a difference of 0.36%), Immigrants from Poland (15.4%, a difference of 0.39%), Immigrants from South America (15.5%, a difference of 0.40%), and Luxembourger (15.3%, a difference of 0.45%).
| Demographics | Rating | Rank | Master's Degree |
| Ghanaians | 78.2 /100 | #149 | Good 15.5% |
| Slovenes | 78.0 /100 | #150 | Good 15.5% |
| Iraqis | 77.3 /100 | #151 | Good 15.5% |
| Slavs | 77.0 /100 | #152 | Good 15.5% |
| Icelanders | 76.8 /100 | #153 | Good 15.5% |
| Immigrants | South America | 76.3 /100 | #154 | Good 15.5% |
| Immigrants | Bangladesh | 76.1 /100 | #155 | Good 15.5% |
| Bermudans | 73.9 /100 | #156 | Good 15.4% |
| Immigrants | Cameroon | 71.7 /100 | #157 | Good 15.4% |
| Immigrants | Poland | 71.5 /100 | #158 | Good 15.4% |
| Luxembourgers | 71.0 /100 | #159 | Good 15.3% |
| Kenyans | 70.3 /100 | #160 | Good 15.3% |
| Sudanese | 68.7 /100 | #161 | Good 15.3% |
| Peruvians | 68.7 /100 | #162 | Good 15.3% |
| Uruguayans | 67.1 /100 | #163 | Good 15.3% |
Demographics Similar to Immigrants from Sudan by Master's Degree
In terms of master's degree, the demographic groups most similar to Immigrants from Sudan are Serbian (16.1%, a difference of 0.54%), Venezuelan (15.9%, a difference of 0.56%), South American Indian (15.9%, a difference of 0.56%), Taiwanese (16.1%, a difference of 0.63%), and Immigrants from Jordan (16.1%, a difference of 0.95%).
| Demographics | Rating | Rank | Master's Degree |
| Immigrants | Eastern Africa | 95.2 /100 | #126 | Exceptional 16.3% |
| Palestinians | 94.8 /100 | #127 | Exceptional 16.3% |
| Immigrants | Sierra Leone | 94.7 /100 | #128 | Exceptional 16.3% |
| Immigrants | Syria | 93.3 /100 | #129 | Exceptional 16.2% |
| Immigrants | Jordan | 92.7 /100 | #130 | Exceptional 16.1% |
| Taiwanese | 91.9 /100 | #131 | Exceptional 16.1% |
| Serbians | 91.7 /100 | #132 | Exceptional 16.1% |
| Immigrants | Sudan | 90.2 /100 | #133 | Exceptional 16.0% |
| Venezuelans | 88.4 /100 | #134 | Excellent 15.9% |
| South American Indians | 88.4 /100 | #135 | Excellent 15.9% |
| Assyrians/Chaldeans/Syriacs | 86.8 /100 | #136 | Excellent 15.8% |
| Europeans | 86.4 /100 | #137 | Excellent 15.8% |
| Pakistanis | 86.1 /100 | #138 | Excellent 15.8% |
| Immigrants | Germany | 85.9 /100 | #139 | Excellent 15.8% |
| Vietnamese | 85.5 /100 | #140 | Excellent 15.8% |