Belizean vs Turkish Single Female Poverty
COMPARE
Belizean
Turkish
Single Female Poverty
Single Female Poverty Comparison
Belizeans
Turks
22.4%
SINGLE FEMALE POVERTY
1.4/ 100
METRIC RATING
248th/ 347
METRIC RANK
18.7%
SINGLE FEMALE POVERTY
99.9/ 100
METRIC RATING
36th/ 347
METRIC RANK
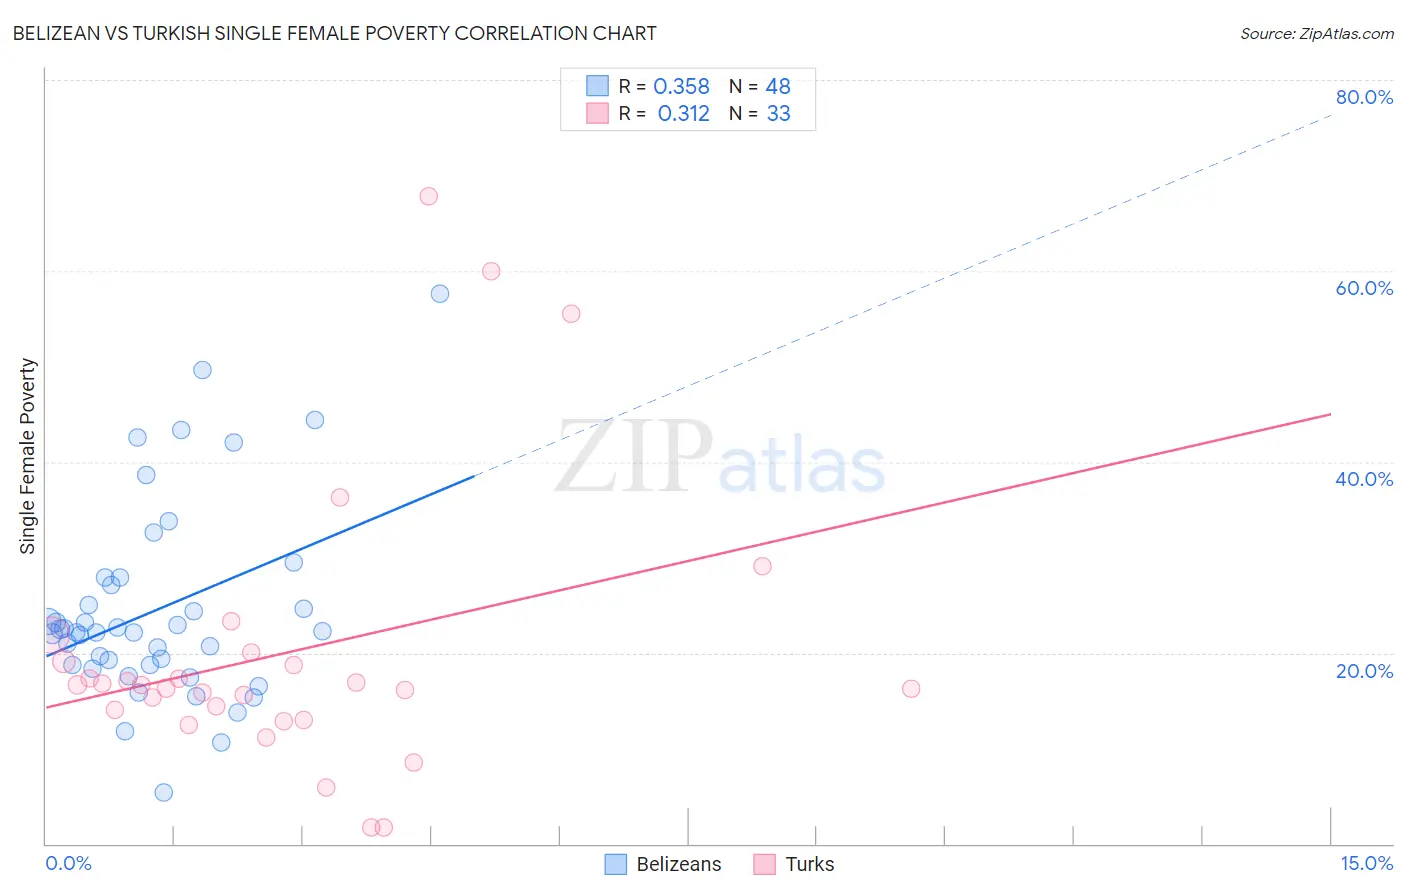
Belizean vs Turkish Single Female Poverty Correlation Chart
The statistical analysis conducted on geographies consisting of 143,694,169 people shows a mild positive correlation between the proportion of Belizeans and poverty level among single females in the United States with a correlation coefficient (R) of 0.358 and weighted average of 22.4%. Similarly, the statistical analysis conducted on geographies consisting of 268,182,441 people shows a mild positive correlation between the proportion of Turks and poverty level among single females in the United States with a correlation coefficient (R) of 0.312 and weighted average of 18.7%, a difference of 20.1%.
Single Female Poverty Correlation Summary
| Measurement | Belizean | Turkish |
| Minimum | 5.4% | 1.7% |
| Maximum | 57.6% | 67.9% |
| Range | 52.3% | 66.2% |
| Mean | 24.6% | 20.0% |
| Median | 22.2% | 16.6% |
| Interquartile 25% (IQ1) | 18.7% | 13.5% |
| Interquartile 75% (IQ3) | 27.5% | 19.6% |
| Interquartile Range (IQR) | 8.8% | 6.1% |
| Standard Deviation (Sample) | 10.4% | 14.8% |
| Standard Deviation (Population) | 10.2% | 14.6% |
Similar Demographics by Single Female Poverty
Demographics Similar to Belizeans by Single Female Poverty
In terms of single female poverty, the demographic groups most similar to Belizeans are Immigrants from El Salvador (22.4%, a difference of 0.010%), Liberian (22.4%, a difference of 0.070%), Immigrants from Caribbean (22.4%, a difference of 0.10%), Immigrants from Bahamas (22.5%, a difference of 0.25%), and Immigrants from West Indies (22.5%, a difference of 0.39%).
| Demographics | Rating | Rank | Single Female Poverty |
| Cape Verdeans | 2.1 /100 | #241 | Tragic 22.3% |
| Bermudans | 2.0 /100 | #242 | Tragic 22.3% |
| West Indians | 1.9 /100 | #243 | Tragic 22.3% |
| Immigrants | Middle Africa | 1.9 /100 | #244 | Tragic 22.3% |
| Immigrants | Bangladesh | 1.8 /100 | #245 | Tragic 22.3% |
| Liberians | 1.4 /100 | #246 | Tragic 22.4% |
| Immigrants | El Salvador | 1.4 /100 | #247 | Tragic 22.4% |
| Belizeans | 1.4 /100 | #248 | Tragic 22.4% |
| Immigrants | Caribbean | 1.3 /100 | #249 | Tragic 22.4% |
| Immigrants | Bahamas | 1.2 /100 | #250 | Tragic 22.5% |
| Immigrants | West Indies | 1.0 /100 | #251 | Tragic 22.5% |
| Delaware | 1.0 /100 | #252 | Tragic 22.5% |
| Immigrants | Liberia | 0.9 /100 | #253 | Tragic 22.5% |
| Immigrants | Burma/Myanmar | 0.8 /100 | #254 | Tragic 22.6% |
| Immigrants | Sudan | 0.8 /100 | #255 | Tragic 22.6% |
Demographics Similar to Turks by Single Female Poverty
In terms of single female poverty, the demographic groups most similar to Turks are Immigrants from Armenia (18.7%, a difference of 0.020%), Immigrants from Japan (18.6%, a difference of 0.18%), Korean (18.6%, a difference of 0.24%), Immigrants from Philippines (18.6%, a difference of 0.42%), and Immigrants from Sri Lanka (18.6%, a difference of 0.49%).
| Demographics | Rating | Rank | Single Female Poverty |
| Immigrants | Poland | 100.0 /100 | #29 | Exceptional 18.5% |
| Immigrants | North Macedonia | 99.9 /100 | #30 | Exceptional 18.5% |
| Immigrants | Asia | 99.9 /100 | #31 | Exceptional 18.6% |
| Immigrants | Sri Lanka | 99.9 /100 | #32 | Exceptional 18.6% |
| Immigrants | Philippines | 99.9 /100 | #33 | Exceptional 18.6% |
| Koreans | 99.9 /100 | #34 | Exceptional 18.6% |
| Immigrants | Japan | 99.9 /100 | #35 | Exceptional 18.6% |
| Turks | 99.9 /100 | #36 | Exceptional 18.7% |
| Immigrants | Armenia | 99.9 /100 | #37 | Exceptional 18.7% |
| Tongans | 99.9 /100 | #38 | Exceptional 18.8% |
| Bulgarians | 99.9 /100 | #39 | Exceptional 18.8% |
| Okinawans | 99.9 /100 | #40 | Exceptional 18.8% |
| Immigrants | Serbia | 99.9 /100 | #41 | Exceptional 18.8% |
| Jordanians | 99.9 /100 | #42 | Exceptional 18.8% |
| Immigrants | Romania | 99.9 /100 | #43 | Exceptional 18.8% |