Belizean vs Immigrants from Jamaica Single Female Poverty
COMPARE
Belizean
Immigrants from Jamaica
Single Female Poverty
Single Female Poverty Comparison
Belizeans
Immigrants from Jamaica
22.4%
SINGLE FEMALE POVERTY
1.4/ 100
METRIC RATING
248th/ 347
METRIC RANK
21.3%
SINGLE FEMALE POVERTY
30.5/ 100
METRIC RATING
192nd/ 347
METRIC RANK
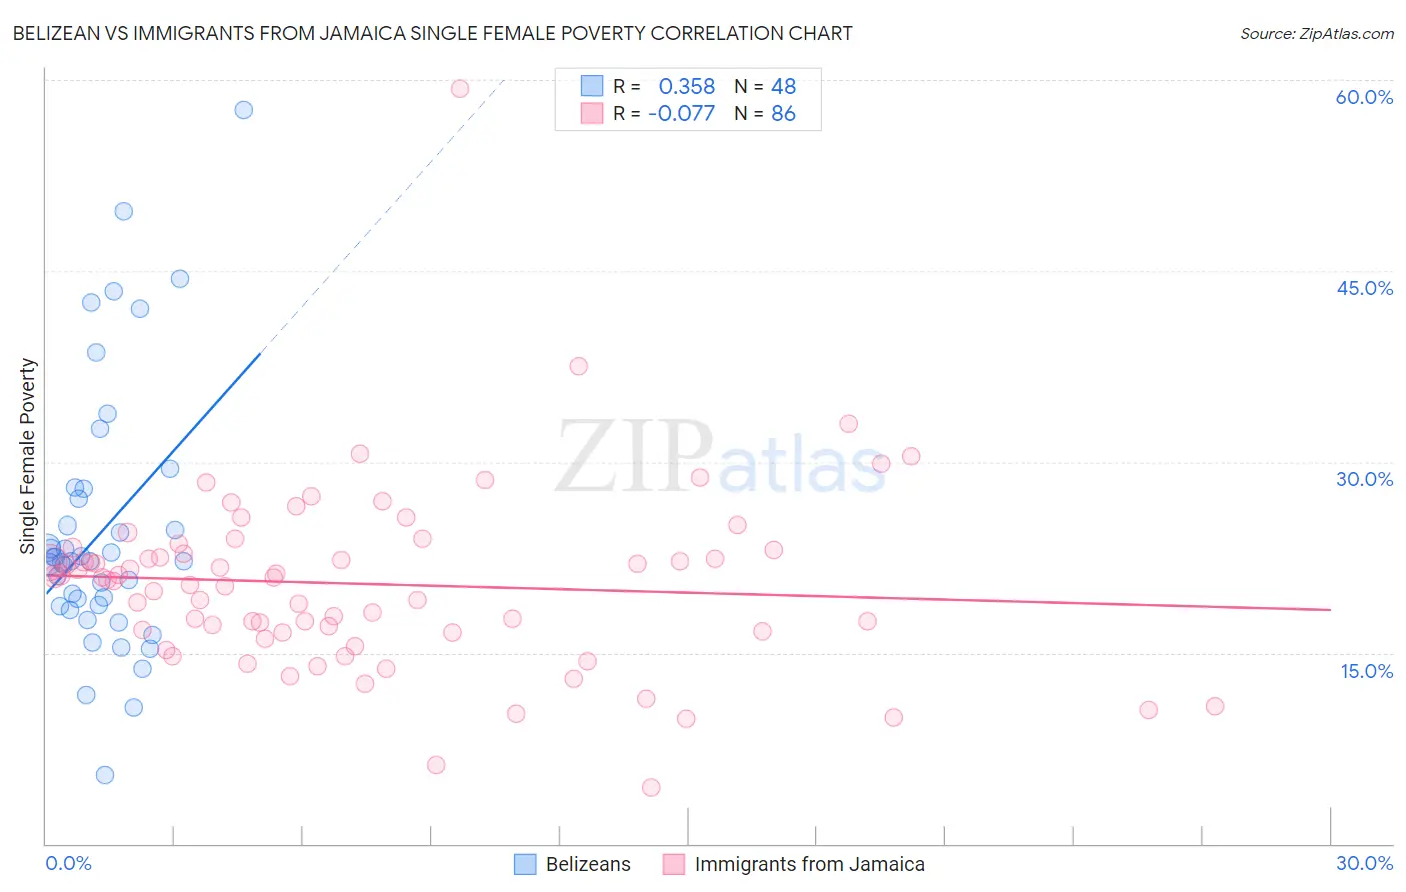
Belizean vs Immigrants from Jamaica Single Female Poverty Correlation Chart
The statistical analysis conducted on geographies consisting of 143,694,169 people shows a mild positive correlation between the proportion of Belizeans and poverty level among single females in the United States with a correlation coefficient (R) of 0.358 and weighted average of 22.4%. Similarly, the statistical analysis conducted on geographies consisting of 298,568,365 people shows a slight negative correlation between the proportion of Immigrants from Jamaica and poverty level among single females in the United States with a correlation coefficient (R) of -0.077 and weighted average of 21.3%, a difference of 5.3%.
Single Female Poverty Correlation Summary
| Measurement | Belizean | Immigrants from Jamaica |
| Minimum | 5.4% | 4.4% |
| Maximum | 57.6% | 59.3% |
| Range | 52.3% | 54.9% |
| Mean | 24.6% | 20.4% |
| Median | 22.2% | 20.8% |
| Interquartile 25% (IQ1) | 18.7% | 16.6% |
| Interquartile 75% (IQ3) | 27.5% | 23.1% |
| Interquartile Range (IQR) | 8.8% | 6.5% |
| Standard Deviation (Sample) | 10.4% | 7.3% |
| Standard Deviation (Population) | 10.2% | 7.2% |
Similar Demographics by Single Female Poverty
Demographics Similar to Belizeans by Single Female Poverty
In terms of single female poverty, the demographic groups most similar to Belizeans are Immigrants from El Salvador (22.4%, a difference of 0.010%), Liberian (22.4%, a difference of 0.070%), Immigrants from Caribbean (22.4%, a difference of 0.10%), Immigrants from Bahamas (22.5%, a difference of 0.25%), and Immigrants from West Indies (22.5%, a difference of 0.39%).
| Demographics | Rating | Rank | Single Female Poverty |
| Cape Verdeans | 2.1 /100 | #241 | Tragic 22.3% |
| Bermudans | 2.0 /100 | #242 | Tragic 22.3% |
| West Indians | 1.9 /100 | #243 | Tragic 22.3% |
| Immigrants | Middle Africa | 1.9 /100 | #244 | Tragic 22.3% |
| Immigrants | Bangladesh | 1.8 /100 | #245 | Tragic 22.3% |
| Liberians | 1.4 /100 | #246 | Tragic 22.4% |
| Immigrants | El Salvador | 1.4 /100 | #247 | Tragic 22.4% |
| Belizeans | 1.4 /100 | #248 | Tragic 22.4% |
| Immigrants | Caribbean | 1.3 /100 | #249 | Tragic 22.4% |
| Immigrants | Bahamas | 1.2 /100 | #250 | Tragic 22.5% |
| Immigrants | West Indies | 1.0 /100 | #251 | Tragic 22.5% |
| Delaware | 1.0 /100 | #252 | Tragic 22.5% |
| Immigrants | Liberia | 0.9 /100 | #253 | Tragic 22.5% |
| Immigrants | Burma/Myanmar | 0.8 /100 | #254 | Tragic 22.6% |
| Immigrants | Sudan | 0.8 /100 | #255 | Tragic 22.6% |
Demographics Similar to Immigrants from Jamaica by Single Female Poverty
In terms of single female poverty, the demographic groups most similar to Immigrants from Jamaica are Immigrants from Germany (21.3%, a difference of 0.040%), Basque (21.3%, a difference of 0.18%), Czechoslovakian (21.3%, a difference of 0.21%), Nicaraguan (21.3%, a difference of 0.22%), and Immigrants from Saudi Arabia (21.3%, a difference of 0.26%).
| Demographics | Rating | Rank | Single Female Poverty |
| Immigrants | Cambodia | 38.2 /100 | #185 | Fair 21.2% |
| Hawaiians | 37.7 /100 | #186 | Fair 21.2% |
| Immigrants | Nigeria | 36.8 /100 | #187 | Fair 21.2% |
| Yugoslavians | 35.4 /100 | #188 | Fair 21.2% |
| Immigrants | Cuba | 35.3 /100 | #189 | Fair 21.2% |
| Trinidadians and Tobagonians | 35.2 /100 | #190 | Fair 21.2% |
| Immigrants | Germany | 31.1 /100 | #191 | Fair 21.3% |
| Immigrants | Jamaica | 30.5 /100 | #192 | Fair 21.3% |
| Basques | 28.1 /100 | #193 | Fair 21.3% |
| Czechoslovakians | 27.7 /100 | #194 | Fair 21.3% |
| Nicaraguans | 27.6 /100 | #195 | Fair 21.3% |
| Immigrants | Saudi Arabia | 27.1 /100 | #196 | Fair 21.3% |
| Japanese | 26.4 /100 | #197 | Fair 21.3% |
| Swiss | 24.2 /100 | #198 | Fair 21.4% |
| Immigrants | Immigrants | 22.0 /100 | #199 | Fair 21.4% |