Belizean vs Turkish Unemployment Among Ages 25 to 29 years
COMPARE
Belizean
Turkish
Unemployment Among Ages 25 to 29 years
Unemployment Among Ages 25 to 29 years Comparison
Belizeans
Turks
7.7%
UNEMPLOYMENT AMONG AGES 25 TO 29 YEARS
0.0/ 100
METRIC RATING
289th/ 347
METRIC RANK
6.2%
UNEMPLOYMENT AMONG AGES 25 TO 29 YEARS
98.8/ 100
METRIC RATING
53rd/ 347
METRIC RANK
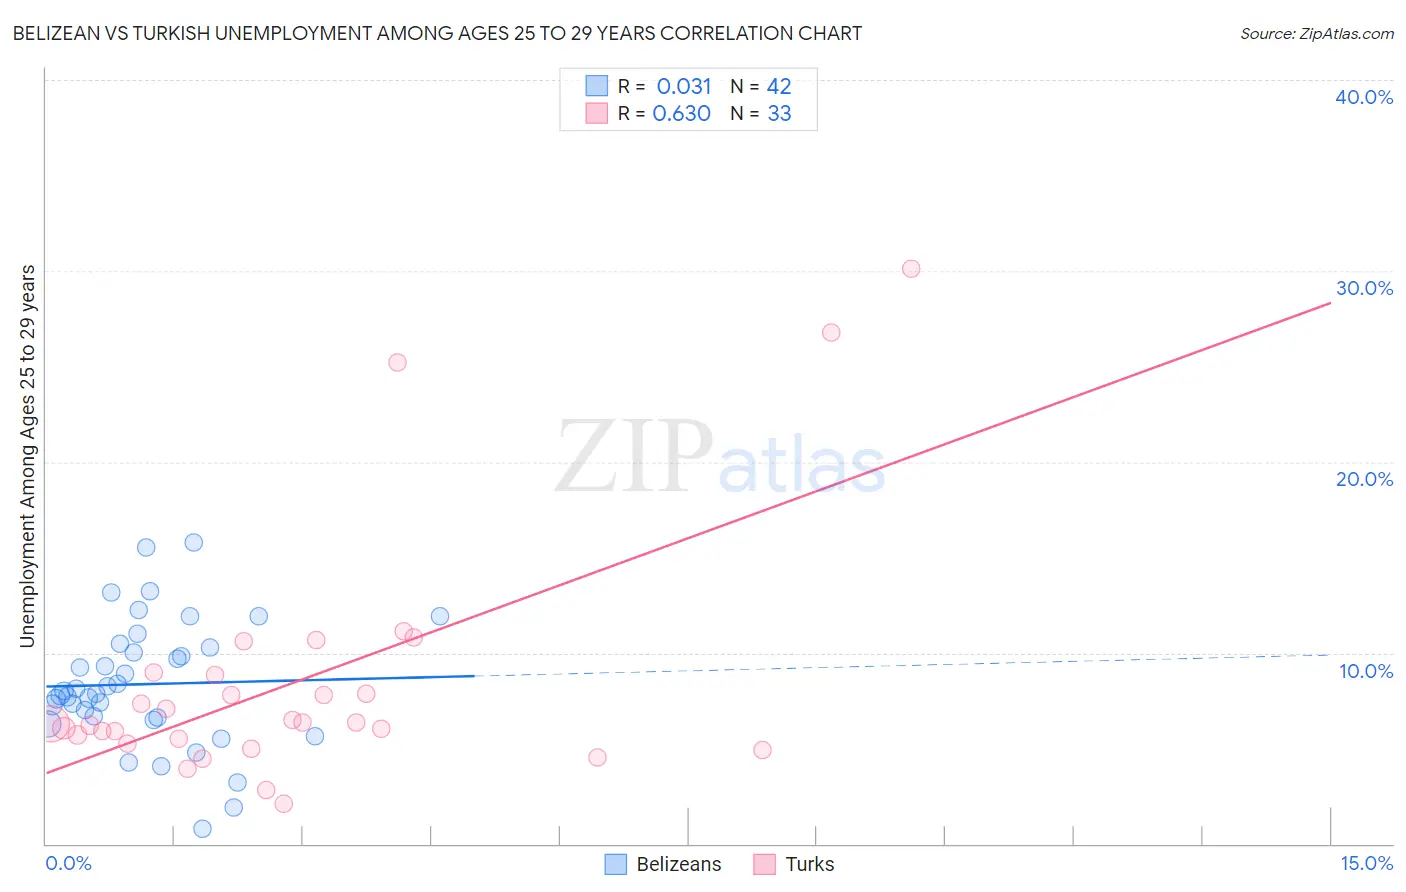
Belizean vs Turkish Unemployment Among Ages 25 to 29 years Correlation Chart
The statistical analysis conducted on geographies consisting of 142,349,315 people shows no correlation between the proportion of Belizeans and unemployment rate among population between the ages 25 and 29 in the United States with a correlation coefficient (R) of 0.031 and weighted average of 7.7%. Similarly, the statistical analysis conducted on geographies consisting of 263,158,827 people shows a significant positive correlation between the proportion of Turks and unemployment rate among population between the ages 25 and 29 in the United States with a correlation coefficient (R) of 0.630 and weighted average of 6.2%, a difference of 24.2%.
Unemployment Among Ages 25 to 29 years Correlation Summary
| Measurement | Belizean | Turkish |
| Minimum | 0.80% | 2.1% |
| Maximum | 15.8% | 30.1% |
| Range | 15.0% | 28.0% |
| Mean | 8.4% | 8.5% |
| Median | 7.9% | 6.3% |
| Interquartile 25% (IQ1) | 6.6% | 5.4% |
| Interquartile 75% (IQ3) | 10.3% | 8.9% |
| Interquartile Range (IQR) | 3.7% | 3.5% |
| Standard Deviation (Sample) | 3.3% | 6.5% |
| Standard Deviation (Population) | 3.2% | 6.4% |
Similar Demographics by Unemployment Among Ages 25 to 29 years
Demographics Similar to Belizeans by Unemployment Among Ages 25 to 29 years
In terms of unemployment among ages 25 to 29 years, the demographic groups most similar to Belizeans are Armenian (7.7%, a difference of 0.10%), Hispanic or Latino (7.7%, a difference of 0.49%), African (7.6%, a difference of 0.71%), Immigrants from Mexico (7.6%, a difference of 0.77%), and Chippewa (7.8%, a difference of 0.90%).
| Demographics | Rating | Rank | Unemployment Among Ages 25 to 29 years |
| Immigrants | Senegal | 0.0 /100 | #282 | Tragic 7.6% |
| Creek | 0.0 /100 | #283 | Tragic 7.6% |
| Cherokee | 0.0 /100 | #284 | Tragic 7.6% |
| Senegalese | 0.0 /100 | #285 | Tragic 7.6% |
| Vietnamese | 0.0 /100 | #286 | Tragic 7.6% |
| Immigrants | Mexico | 0.0 /100 | #287 | Tragic 7.6% |
| Africans | 0.0 /100 | #288 | Tragic 7.6% |
| Belizeans | 0.0 /100 | #289 | Tragic 7.7% |
| Armenians | 0.0 /100 | #290 | Tragic 7.7% |
| Hispanics or Latinos | 0.0 /100 | #291 | Tragic 7.7% |
| Chippewa | 0.0 /100 | #292 | Tragic 7.8% |
| Immigrants | Belize | 0.0 /100 | #293 | Tragic 7.8% |
| Trinidadians and Tobagonians | 0.0 /100 | #294 | Tragic 7.8% |
| Comanche | 0.0 /100 | #295 | Tragic 7.8% |
| Immigrants | West Indies | 0.0 /100 | #296 | Tragic 7.8% |
Demographics Similar to Turks by Unemployment Among Ages 25 to 29 years
In terms of unemployment among ages 25 to 29 years, the demographic groups most similar to Turks are Swedish (6.2%, a difference of 0.020%), Immigrants from Turkey (6.2%, a difference of 0.060%), Burmese (6.2%, a difference of 0.11%), Soviet Union (6.2%, a difference of 0.14%), and German Russian (6.2%, a difference of 0.20%).
| Demographics | Rating | Rank | Unemployment Among Ages 25 to 29 years |
| Immigrants | Lithuania | 99.0 /100 | #46 | Exceptional 6.2% |
| Latvians | 99.0 /100 | #47 | Exceptional 6.2% |
| Immigrants | Australia | 99.0 /100 | #48 | Exceptional 6.2% |
| German Russians | 99.0 /100 | #49 | Exceptional 6.2% |
| Soviet Union | 98.9 /100 | #50 | Exceptional 6.2% |
| Burmese | 98.9 /100 | #51 | Exceptional 6.2% |
| Immigrants | Turkey | 98.9 /100 | #52 | Exceptional 6.2% |
| Turks | 98.8 /100 | #53 | Exceptional 6.2% |
| Swedes | 98.8 /100 | #54 | Exceptional 6.2% |
| Immigrants | Netherlands | 98.7 /100 | #55 | Exceptional 6.2% |
| Immigrants | Burma/Myanmar | 98.7 /100 | #56 | Exceptional 6.2% |
| Immigrants | Saudi Arabia | 98.6 /100 | #57 | Exceptional 6.2% |
| Immigrants | Eastern Asia | 98.4 /100 | #58 | Exceptional 6.2% |
| Luxembourgers | 98.3 /100 | #59 | Exceptional 6.2% |
| Immigrants | Taiwan | 98.3 /100 | #60 | Exceptional 6.2% |