Basque vs Tsimshian In Labor Force | Age 20-64
COMPARE
Basque
Tsimshian
In Labor Force | Age 20-64
In Labor Force | Age 20-64 Comparison
Basques
Tsimshian
78.7%
IN LABOR FORCE | AGE 20-64
0.5/ 100
METRIC RATING
253rd/ 347
METRIC RANK
78.7%
IN LABOR FORCE | AGE 20-64
0.4/ 100
METRIC RATING
259th/ 347
METRIC RANK
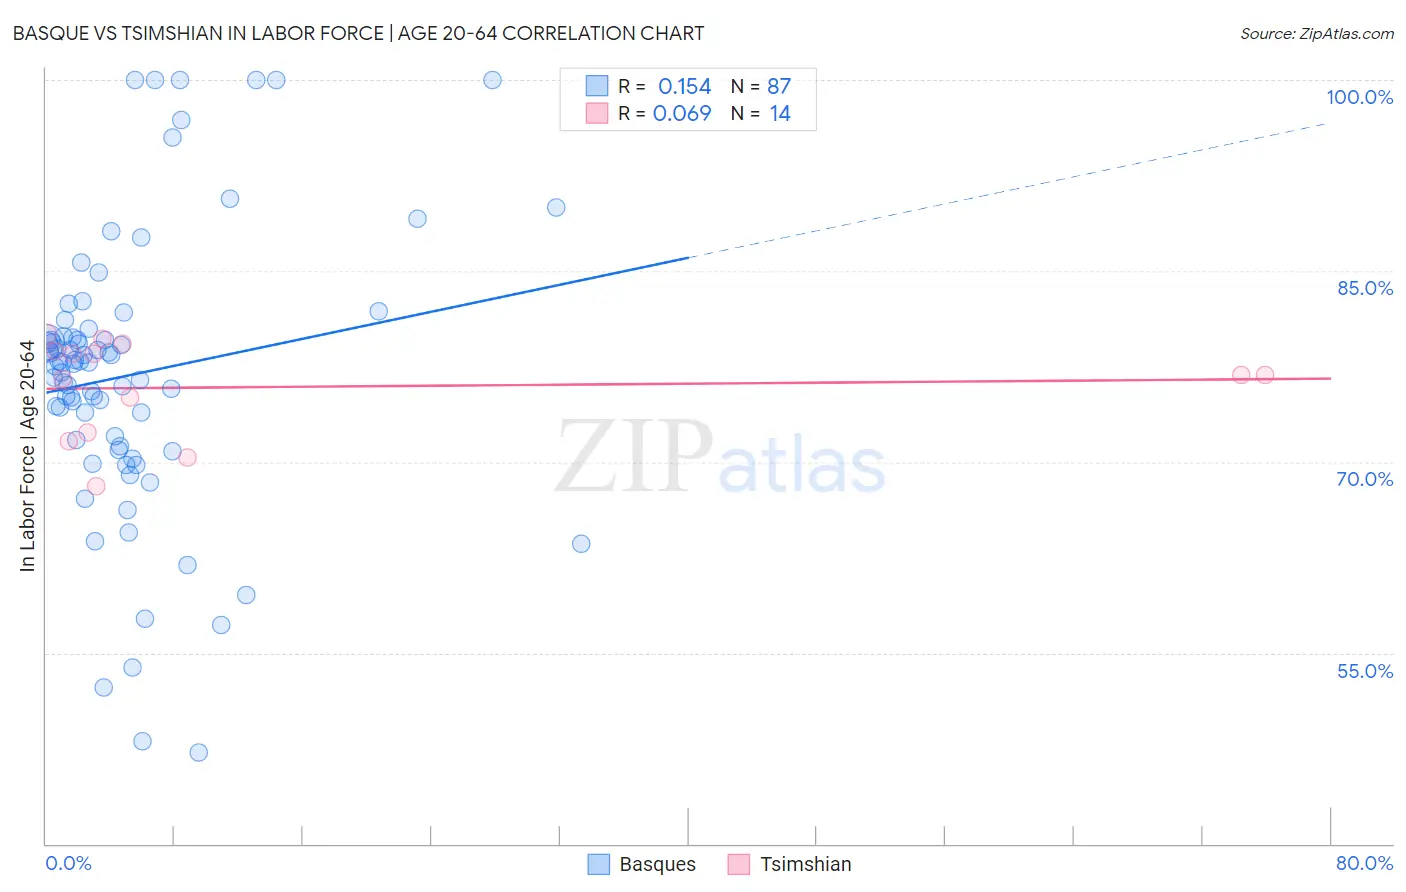
Basque vs Tsimshian In Labor Force | Age 20-64 Correlation Chart
The statistical analysis conducted on geographies consisting of 165,779,636 people shows a poor positive correlation between the proportion of Basques and labor force participation rate among population between the ages 20 and 64 in the United States with a correlation coefficient (R) of 0.154 and weighted average of 78.7%. Similarly, the statistical analysis conducted on geographies consisting of 15,626,183 people shows a slight positive correlation between the proportion of Tsimshian and labor force participation rate among population between the ages 20 and 64 in the United States with a correlation coefficient (R) of 0.069 and weighted average of 78.7%, a difference of 0.080%.
In Labor Force | Age 20-64 Correlation Summary
| Measurement | Basque | Tsimshian |
| Minimum | 47.2% | 68.1% |
| Maximum | 100.0% | 80.1% |
| Range | 52.8% | 12.0% |
| Mean | 76.8% | 75.9% |
| Median | 77.8% | 76.8% |
| Interquartile 25% (IQ1) | 71.2% | 72.3% |
| Interquartile 75% (IQ3) | 79.8% | 78.7% |
| Interquartile Range (IQR) | 8.6% | 6.4% |
| Standard Deviation (Sample) | 11.0% | 3.8% |
| Standard Deviation (Population) | 11.0% | 3.7% |
Demographics Similar to Basques and Tsimshian by In Labor Force | Age 20-64
In terms of in labor force | age 20-64, the demographic groups most similar to Basques are Immigrants from Lebanon (78.7%, a difference of 0.0%), Immigrants from Honduras (78.7%, a difference of 0.010%), Hawaiian (78.7%, a difference of 0.020%), Celtic (78.7%, a difference of 0.020%), and Guatemalan (78.7%, a difference of 0.040%). Similarly, the demographic groups most similar to Tsimshian are Immigrants from Guatemala (78.7%, a difference of 0.030%), Guatemalan (78.7%, a difference of 0.040%), Hawaiian (78.7%, a difference of 0.050%), Celtic (78.7%, a difference of 0.050%), and Immigrants from Lebanon (78.7%, a difference of 0.070%).
| Demographics | Rating | Rank | In Labor Force | Age 20-64 |
| Immigrants | Trinidad and Tobago | 1.1 /100 | #246 | Tragic 78.8% |
| Immigrants | Germany | 1.0 /100 | #247 | Tragic 78.8% |
| Immigrants | Caribbean | 1.0 /100 | #248 | Tragic 78.8% |
| English | 0.9 /100 | #249 | Tragic 78.8% |
| Hondurans | 0.8 /100 | #250 | Tragic 78.8% |
| Barbadians | 0.7 /100 | #251 | Tragic 78.8% |
| Immigrants | Honduras | 0.6 /100 | #252 | Tragic 78.7% |
| Basques | 0.5 /100 | #253 | Tragic 78.7% |
| Immigrants | Lebanon | 0.5 /100 | #254 | Tragic 78.7% |
| Hawaiians | 0.5 /100 | #255 | Tragic 78.7% |
| Celtics | 0.5 /100 | #256 | Tragic 78.7% |
| Guatemalans | 0.4 /100 | #257 | Tragic 78.7% |
| Immigrants | Guatemala | 0.4 /100 | #258 | Tragic 78.7% |
| Tsimshian | 0.4 /100 | #259 | Tragic 78.7% |
| Immigrants | Fiji | 0.3 /100 | #260 | Tragic 78.6% |
| Whites/Caucasians | 0.2 /100 | #261 | Tragic 78.5% |
| Fijians | 0.1 /100 | #262 | Tragic 78.4% |
| Pennsylvania Germans | 0.1 /100 | #263 | Tragic 78.4% |
| Spaniards | 0.1 /100 | #264 | Tragic 78.4% |
| British West Indians | 0.1 /100 | #265 | Tragic 78.4% |
| Bahamians | 0.1 /100 | #266 | Tragic 78.4% |