Basque vs Palestinian Male Poverty
COMPARE
Basque
Palestinian
Male Poverty
Male Poverty Comparison
Basques
Palestinians
10.9%
MALE POVERTY
74.6/ 100
METRIC RATING
142nd/ 347
METRIC RANK
10.6%
MALE POVERTY
89.1/ 100
METRIC RATING
113th/ 347
METRIC RANK
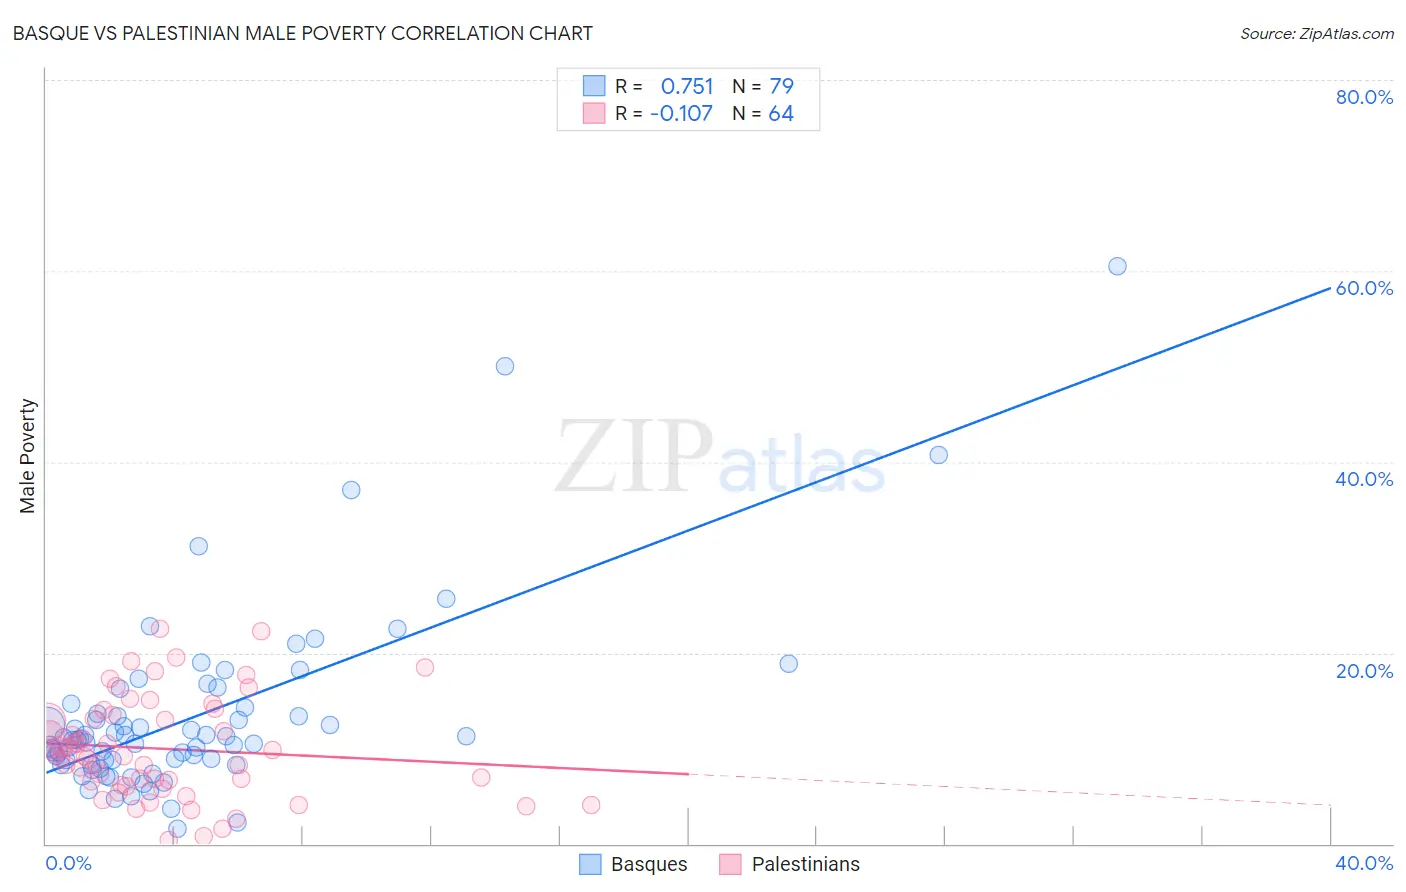
Basque vs Palestinian Male Poverty Correlation Chart
The statistical analysis conducted on geographies consisting of 165,709,169 people shows a strong positive correlation between the proportion of Basques and poverty level among males in the United States with a correlation coefficient (R) of 0.751 and weighted average of 10.9%. Similarly, the statistical analysis conducted on geographies consisting of 216,357,204 people shows a poor negative correlation between the proportion of Palestinians and poverty level among males in the United States with a correlation coefficient (R) of -0.107 and weighted average of 10.6%, a difference of 2.6%.
Male Poverty Correlation Summary
| Measurement | Basque | Palestinian |
| Minimum | 1.5% | 0.38% |
| Maximum | 60.5% | 22.5% |
| Range | 59.0% | 22.1% |
| Mean | 13.3% | 9.9% |
| Median | 10.9% | 9.2% |
| Interquartile 25% (IQ1) | 8.7% | 6.3% |
| Interquartile 75% (IQ3) | 14.3% | 13.3% |
| Interquartile Range (IQR) | 5.6% | 6.9% |
| Standard Deviation (Sample) | 9.6% | 5.2% |
| Standard Deviation (Population) | 9.5% | 5.2% |
Similar Demographics by Male Poverty
Demographics Similar to Basques by Male Poverty
In terms of male poverty, the demographic groups most similar to Basques are Immigrants from France (10.9%, a difference of 0.17%), Tlingit-Haida (10.9%, a difference of 0.20%), Afghan (10.9%, a difference of 0.34%), Samoan (10.9%, a difference of 0.36%), and Immigrants from Germany (10.9%, a difference of 0.38%).
| Demographics | Rating | Rank | Male Poverty |
| Brazilians | 82.7 /100 | #135 | Excellent 10.8% |
| Immigrants | Israel | 80.9 /100 | #136 | Excellent 10.8% |
| Immigrants | Switzerland | 79.2 /100 | #137 | Good 10.8% |
| Yugoslavians | 78.2 /100 | #138 | Good 10.8% |
| Immigrants | Jordan | 77.5 /100 | #139 | Good 10.8% |
| Tlingit-Haida | 76.1 /100 | #140 | Good 10.9% |
| Immigrants | France | 75.8 /100 | #141 | Good 10.9% |
| Basques | 74.6 /100 | #142 | Good 10.9% |
| Afghans | 71.9 /100 | #143 | Good 10.9% |
| Samoans | 71.8 /100 | #144 | Good 10.9% |
| Immigrants | Germany | 71.6 /100 | #145 | Good 10.9% |
| Syrians | 71.4 /100 | #146 | Good 10.9% |
| Icelanders | 68.5 /100 | #147 | Good 11.0% |
| Armenians | 68.0 /100 | #148 | Good 11.0% |
| Immigrants | Venezuela | 67.9 /100 | #149 | Good 11.0% |
Demographics Similar to Palestinians by Male Poverty
In terms of male poverty, the demographic groups most similar to Palestinians are Immigrants from Brazil (10.6%, a difference of 0.020%), Immigrants from Turkey (10.6%, a difference of 0.10%), Immigrants from Russia (10.6%, a difference of 0.14%), Immigrants from Argentina (10.6%, a difference of 0.18%), and Sri Lankan (10.6%, a difference of 0.25%).
| Demographics | Rating | Rank | Male Poverty |
| Immigrants | Southern Europe | 91.3 /100 | #106 | Exceptional 10.5% |
| Laotians | 91.2 /100 | #107 | Exceptional 10.5% |
| Portuguese | 91.0 /100 | #108 | Exceptional 10.6% |
| Albanians | 90.6 /100 | #109 | Exceptional 10.6% |
| Argentineans | 90.1 /100 | #110 | Exceptional 10.6% |
| Immigrants | Argentina | 89.8 /100 | #111 | Excellent 10.6% |
| Immigrants | Turkey | 89.5 /100 | #112 | Excellent 10.6% |
| Palestinians | 89.1 /100 | #113 | Excellent 10.6% |
| Immigrants | Brazil | 89.0 /100 | #114 | Excellent 10.6% |
| Immigrants | Russia | 88.6 /100 | #115 | Excellent 10.6% |
| Sri Lankans | 88.1 /100 | #116 | Excellent 10.6% |
| Immigrants | South Eastern Asia | 88.1 /100 | #117 | Excellent 10.6% |
| Okinawans | 87.6 /100 | #118 | Excellent 10.7% |
| Immigrants | Hungary | 87.6 /100 | #119 | Excellent 10.7% |
| Immigrants | China | 87.1 /100 | #120 | Excellent 10.7% |