Basque vs Bangladeshi Female Poverty
COMPARE
Basque
Bangladeshi
Female Poverty
Female Poverty Comparison
Basques
Bangladeshis
12.9%
FEMALE POVERTY
83.1/ 100
METRIC RATING
139th/ 347
METRIC RANK
16.0%
FEMALE POVERTY
0.0/ 100
METRIC RATING
277th/ 347
METRIC RANK
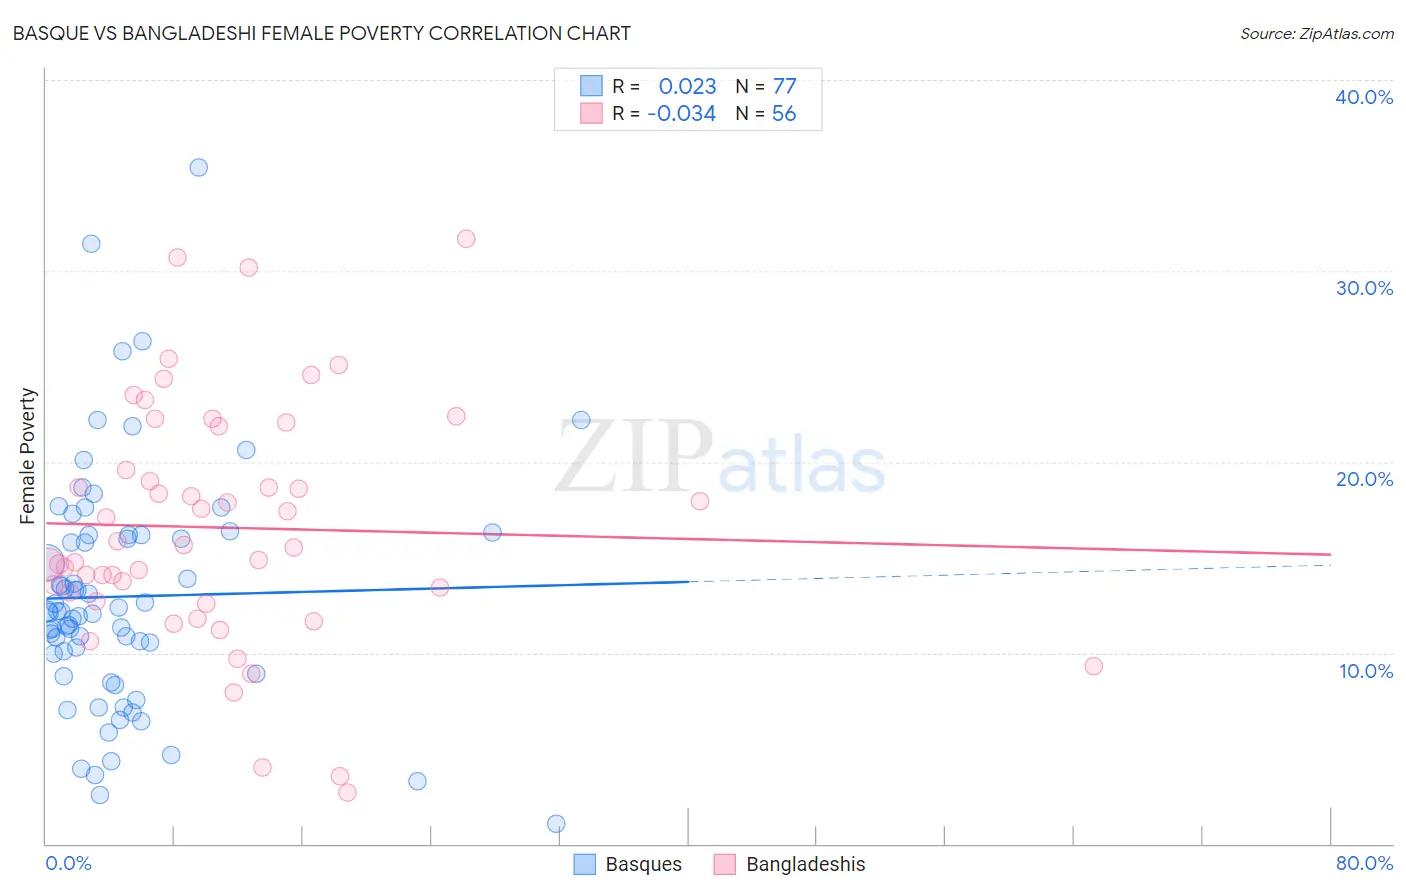
Basque vs Bangladeshi Female Poverty Correlation Chart
The statistical analysis conducted on geographies consisting of 165,726,735 people shows no correlation between the proportion of Basques and poverty level among females in the United States with a correlation coefficient (R) of 0.023 and weighted average of 12.9%. Similarly, the statistical analysis conducted on geographies consisting of 141,353,886 people shows no correlation between the proportion of Bangladeshis and poverty level among females in the United States with a correlation coefficient (R) of -0.034 and weighted average of 16.0%, a difference of 23.8%.
Female Poverty Correlation Summary
| Measurement | Basque | Bangladeshi |
| Minimum | 1.1% | 2.7% |
| Maximum | 35.4% | 31.7% |
| Range | 34.4% | 29.0% |
| Mean | 12.9% | 16.6% |
| Median | 12.2% | 15.6% |
| Interquartile 25% (IQ1) | 9.4% | 12.9% |
| Interquartile 75% (IQ3) | 16.2% | 20.7% |
| Interquartile Range (IQR) | 6.7% | 7.8% |
| Standard Deviation (Sample) | 6.2% | 6.3% |
| Standard Deviation (Population) | 6.1% | 6.2% |
Similar Demographics by Female Poverty
Demographics Similar to Basques by Female Poverty
In terms of female poverty, the demographic groups most similar to Basques are Pakistani (12.9%, a difference of 0.010%), Immigrants from France (12.9%, a difference of 0.090%), Chilean (12.9%, a difference of 0.31%), Icelander (13.0%, a difference of 0.34%), and Peruvian (12.9%, a difference of 0.40%).
| Demographics | Rating | Rank | Female Poverty |
| Immigrants | Jordan | 86.9 /100 | #132 | Excellent 12.8% |
| Immigrants | Western Europe | 86.6 /100 | #133 | Excellent 12.8% |
| Immigrants | Switzerland | 85.8 /100 | #134 | Excellent 12.9% |
| French | 85.6 /100 | #135 | Excellent 12.9% |
| Peruvians | 85.2 /100 | #136 | Excellent 12.9% |
| Chileans | 84.7 /100 | #137 | Excellent 12.9% |
| Immigrants | France | 83.6 /100 | #138 | Excellent 12.9% |
| Basques | 83.1 /100 | #139 | Excellent 12.9% |
| Pakistanis | 83.0 /100 | #140 | Excellent 12.9% |
| Icelanders | 81.1 /100 | #141 | Excellent 13.0% |
| Brazilians | 80.5 /100 | #142 | Excellent 13.0% |
| Immigrants | Malaysia | 80.4 /100 | #143 | Excellent 13.0% |
| Afghans | 79.8 /100 | #144 | Good 13.0% |
| Syrians | 79.6 /100 | #145 | Good 13.0% |
| Immigrants | Peru | 79.1 /100 | #146 | Good 13.0% |
Demographics Similar to Bangladeshis by Female Poverty
In terms of female poverty, the demographic groups most similar to Bangladeshis are Central American (16.0%, a difference of 0.19%), Immigrants from Barbados (16.0%, a difference of 0.31%), Immigrants from West Indies (16.1%, a difference of 0.31%), Haitian (15.9%, a difference of 0.38%), and Barbadian (15.9%, a difference of 0.38%).
| Demographics | Rating | Rank | Female Poverty |
| Chickasaw | 0.1 /100 | #270 | Tragic 15.9% |
| Immigrants | St. Vincent and the Grenadines | 0.0 /100 | #271 | Tragic 15.9% |
| Belizeans | 0.0 /100 | #272 | Tragic 15.9% |
| Haitians | 0.0 /100 | #273 | Tragic 15.9% |
| Barbadians | 0.0 /100 | #274 | Tragic 15.9% |
| Immigrants | Barbados | 0.0 /100 | #275 | Tragic 16.0% |
| Central Americans | 0.0 /100 | #276 | Tragic 16.0% |
| Bangladeshis | 0.0 /100 | #277 | Tragic 16.0% |
| Immigrants | West Indies | 0.0 /100 | #278 | Tragic 16.1% |
| Immigrants | Bahamas | 0.0 /100 | #279 | Tragic 16.1% |
| Vietnamese | 0.0 /100 | #280 | Tragic 16.1% |
| West Indians | 0.0 /100 | #281 | Tragic 16.1% |
| Immigrants | Haiti | 0.0 /100 | #282 | Tragic 16.1% |
| Immigrants | Cuba | 0.0 /100 | #283 | Tragic 16.1% |
| Spanish Americans | 0.0 /100 | #284 | Tragic 16.2% |