Basque vs Paiute 6th Grade
COMPARE
Basque
Paiute
6th Grade
6th Grade Comparison
Basques
Paiute
97.4%
6TH GRADE
95.4/ 100
METRIC RATING
117th/ 347
METRIC RANK
96.8%
6TH GRADE
7.8/ 100
METRIC RATING
216th/ 347
METRIC RANK
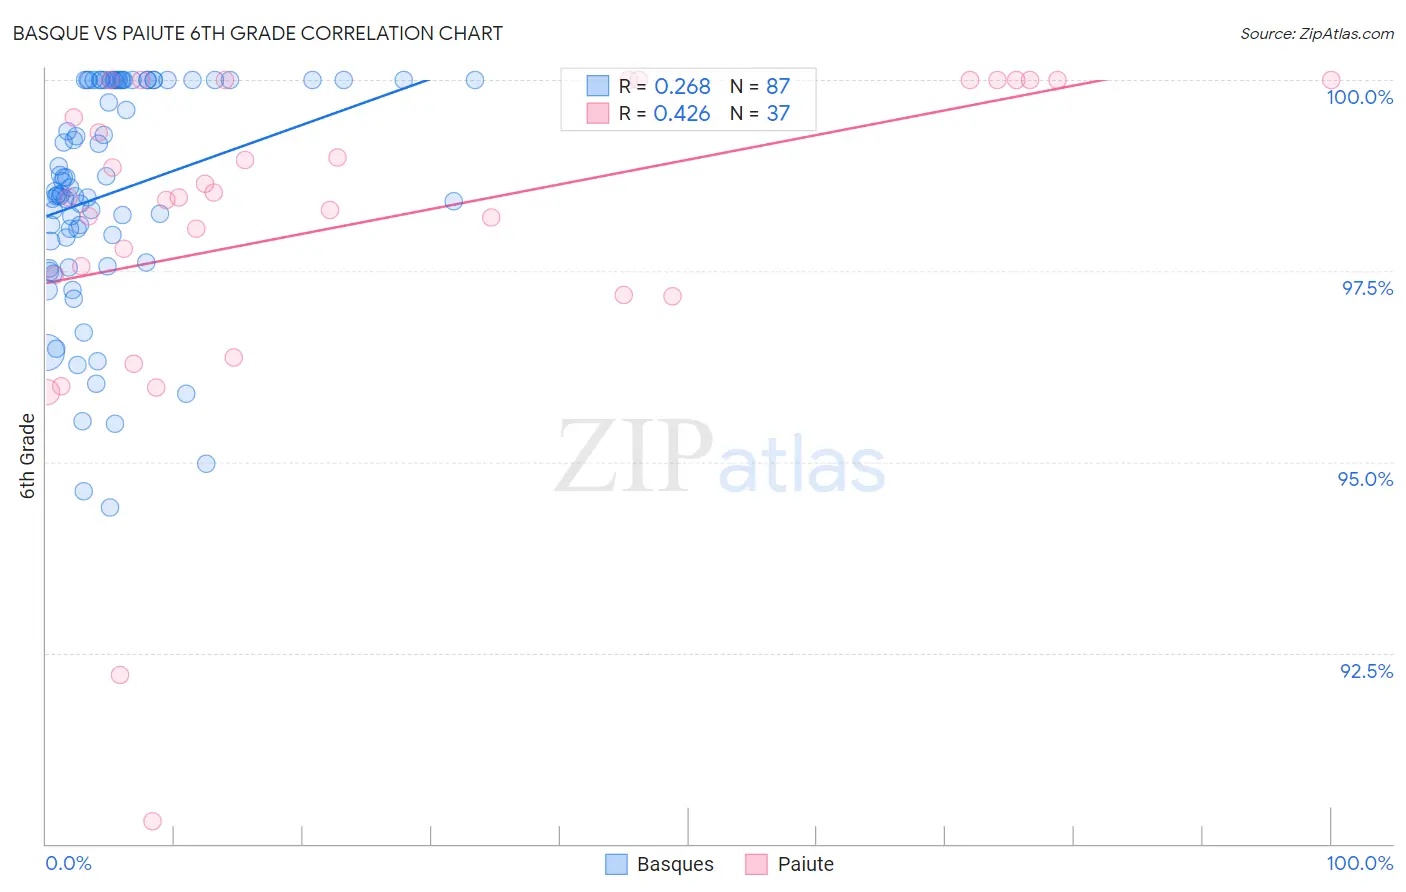
Basque vs Paiute 6th Grade Correlation Chart
The statistical analysis conducted on geographies consisting of 165,772,632 people shows a weak positive correlation between the proportion of Basques and percentage of population with at least 6th grade education in the United States with a correlation coefficient (R) of 0.268 and weighted average of 97.4%. Similarly, the statistical analysis conducted on geographies consisting of 58,402,332 people shows a moderate positive correlation between the proportion of Paiute and percentage of population with at least 6th grade education in the United States with a correlation coefficient (R) of 0.426 and weighted average of 96.8%, a difference of 0.63%.
6th Grade Correlation Summary
| Measurement | Basque | Paiute |
| Minimum | 94.4% | 90.3% |
| Maximum | 100.0% | 100.0% |
| Range | 5.6% | 9.7% |
| Mean | 98.5% | 98.1% |
| Median | 98.5% | 98.5% |
| Interquartile 25% (IQ1) | 97.9% | 97.3% |
| Interquartile 75% (IQ3) | 100.0% | 100.0% |
| Interquartile Range (IQR) | 2.1% | 2.7% |
| Standard Deviation (Sample) | 1.4% | 2.1% |
| Standard Deviation (Population) | 1.4% | 2.1% |
Similar Demographics by 6th Grade
Demographics Similar to Basques by 6th Grade
In terms of 6th grade, the demographic groups most similar to Basques are Lebanese (97.4%, a difference of 0.0%), Immigrants from Japan (97.4%, a difference of 0.0%), Immigrants from Switzerland (97.4%, a difference of 0.010%), Immigrants from Zimbabwe (97.4%, a difference of 0.010%), and Syrian (97.4%, a difference of 0.010%).
| Demographics | Rating | Rank | 6th Grade |
| Thais | 96.9 /100 | #110 | Exceptional 97.4% |
| Iroquois | 96.9 /100 | #111 | Exceptional 97.4% |
| Immigrants | Latvia | 96.7 /100 | #112 | Exceptional 97.4% |
| Immigrants | Saudi Arabia | 96.5 /100 | #113 | Exceptional 97.4% |
| Colville | 96.4 /100 | #114 | Exceptional 97.4% |
| Immigrants | Switzerland | 95.7 /100 | #115 | Exceptional 97.4% |
| Lebanese | 95.5 /100 | #116 | Exceptional 97.4% |
| Basques | 95.4 /100 | #117 | Exceptional 97.4% |
| Immigrants | Japan | 95.2 /100 | #118 | Exceptional 97.4% |
| Immigrants | Zimbabwe | 95.0 /100 | #119 | Exceptional 97.4% |
| Syrians | 94.8 /100 | #120 | Exceptional 97.4% |
| Immigrants | Norway | 94.7 /100 | #121 | Exceptional 97.4% |
| Immigrants | France | 94.5 /100 | #122 | Exceptional 97.4% |
| Hmong | 94.4 /100 | #123 | Exceptional 97.4% |
| Okinawans | 94.2 /100 | #124 | Exceptional 97.4% |
Demographics Similar to Paiute by 6th Grade
In terms of 6th grade, the demographic groups most similar to Paiute are Sierra Leonean (96.8%, a difference of 0.0%), Immigrants from Sudan (96.8%, a difference of 0.010%), Portuguese (96.8%, a difference of 0.010%), Liberian (96.8%, a difference of 0.010%), and Navajo (96.8%, a difference of 0.010%).
| Demographics | Rating | Rank | 6th Grade |
| Immigrants | Oceania | 11.0 /100 | #209 | Poor 96.8% |
| Immigrants | Nepal | 10.1 /100 | #210 | Poor 96.8% |
| Immigrants | Iraq | 9.2 /100 | #211 | Tragic 96.8% |
| Moroccans | 9.0 /100 | #212 | Tragic 96.8% |
| Immigrants | Sudan | 8.7 /100 | #213 | Tragic 96.8% |
| Portuguese | 8.2 /100 | #214 | Tragic 96.8% |
| Sierra Leoneans | 8.0 /100 | #215 | Tragic 96.8% |
| Paiute | 7.8 /100 | #216 | Tragic 96.8% |
| Liberians | 7.5 /100 | #217 | Tragic 96.8% |
| Navajo | 7.3 /100 | #218 | Tragic 96.8% |
| Costa Ricans | 6.8 /100 | #219 | Tragic 96.8% |
| Immigrants | Morocco | 6.2 /100 | #220 | Tragic 96.7% |
| Tongans | 6.1 /100 | #221 | Tragic 96.7% |
| Immigrants | Syria | 5.9 /100 | #222 | Tragic 96.7% |
| Bahamians | 4.8 /100 | #223 | Tragic 96.7% |