Basque vs Immigrants from Norway Poverty
COMPARE
Basque
Immigrants from Norway
Poverty
Poverty Comparison
Basques
Immigrants from Norway
11.9%
POVERTY
80.4/ 100
METRIC RATING
142nd/ 347
METRIC RANK
11.7%
POVERTY
88.0/ 100
METRIC RATING
126th/ 347
METRIC RANK
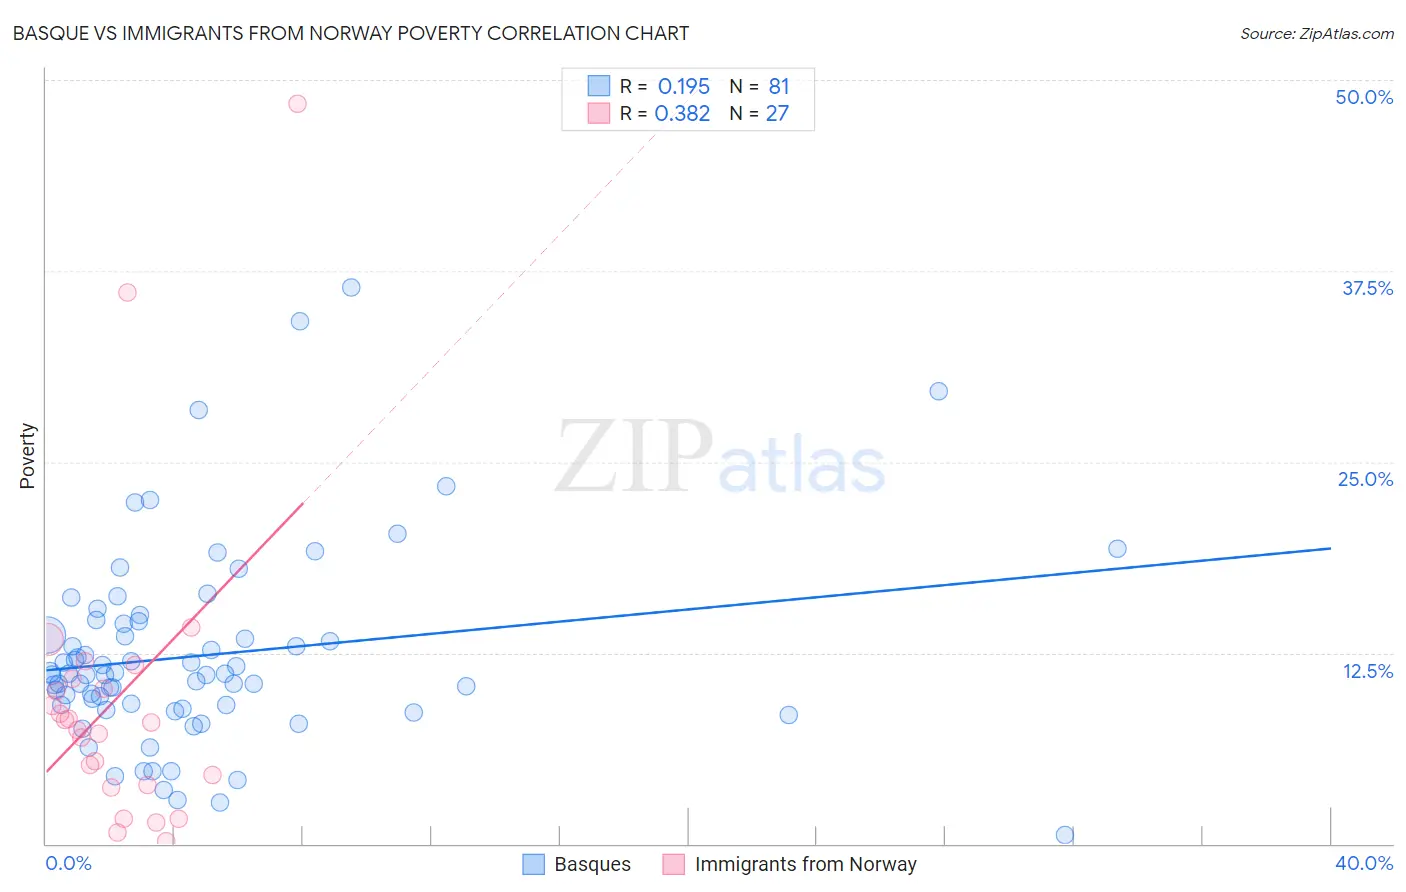
Basque vs Immigrants from Norway Poverty Correlation Chart
The statistical analysis conducted on geographies consisting of 165,732,403 people shows a poor positive correlation between the proportion of Basques and poverty level in the United States with a correlation coefficient (R) of 0.195 and weighted average of 11.9%. Similarly, the statistical analysis conducted on geographies consisting of 116,687,358 people shows a mild positive correlation between the proportion of Immigrants from Norway and poverty level in the United States with a correlation coefficient (R) of 0.382 and weighted average of 11.7%, a difference of 1.5%.
Poverty Correlation Summary
| Measurement | Basque | Immigrants from Norway |
| Minimum | 0.59% | 0.18% |
| Maximum | 36.5% | 48.4% |
| Range | 35.9% | 48.3% |
| Mean | 12.3% | 9.6% |
| Median | 11.1% | 7.9% |
| Interquartile 25% (IQ1) | 9.0% | 3.9% |
| Interquartile 75% (IQ3) | 14.5% | 10.8% |
| Interquartile Range (IQR) | 5.5% | 6.9% |
| Standard Deviation (Sample) | 6.4% | 10.3% |
| Standard Deviation (Population) | 6.4% | 10.1% |
Demographics Similar to Basques and Immigrants from Norway by Poverty
In terms of poverty, the demographic groups most similar to Basques are Immigrants from France (11.9%, a difference of 0.020%), Immigrants from Peru (11.9%, a difference of 0.11%), Brazilian (11.9%, a difference of 0.11%), Pakistani (11.9%, a difference of 0.30%), and Immigrants from Jordan (11.9%, a difference of 0.32%). Similarly, the demographic groups most similar to Immigrants from Norway are Immigrants from Argentina (11.7%, a difference of 0.020%), Immigrants from Brazil (11.7%, a difference of 0.040%), Soviet Union (11.7%, a difference of 0.080%), Immigrants from Israel (11.7%, a difference of 0.14%), and South African (11.7%, a difference of 0.24%).
| Demographics | Rating | Rank | Poverty |
| Soviet Union | 88.4 /100 | #124 | Excellent 11.7% |
| Immigrants | Brazil | 88.2 /100 | #125 | Excellent 11.7% |
| Immigrants | Norway | 88.0 /100 | #126 | Excellent 11.7% |
| Immigrants | Argentina | 88.0 /100 | #127 | Excellent 11.7% |
| Immigrants | Israel | 87.4 /100 | #128 | Excellent 11.7% |
| South Africans | 87.0 /100 | #129 | Excellent 11.7% |
| Immigrants | Ukraine | 86.6 /100 | #130 | Excellent 11.8% |
| French | 86.1 /100 | #131 | Excellent 11.8% |
| Peruvians | 85.6 /100 | #132 | Excellent 11.8% |
| Immigrants | Western Europe | 85.2 /100 | #133 | Excellent 11.8% |
| Yugoslavians | 85.2 /100 | #134 | Excellent 11.8% |
| Immigrants | Vietnam | 85.2 /100 | #135 | Excellent 11.8% |
| Chileans | 84.2 /100 | #136 | Excellent 11.8% |
| Immigrants | Switzerland | 83.0 /100 | #137 | Excellent 11.8% |
| Immigrants | Jordan | 82.4 /100 | #138 | Excellent 11.9% |
| Pakistanis | 82.2 /100 | #139 | Excellent 11.9% |
| Immigrants | Peru | 81.1 /100 | #140 | Excellent 11.9% |
| Immigrants | France | 80.5 /100 | #141 | Excellent 11.9% |
| Basques | 80.4 /100 | #142 | Excellent 11.9% |
| Brazilians | 79.7 /100 | #143 | Good 11.9% |
| Icelanders | 77.9 /100 | #144 | Good 11.9% |