Basque vs Immigrants from the Azores Poverty
COMPARE
Basque
Immigrants from the Azores
Poverty
Poverty Comparison
Basques
Immigrants from the Azores
11.9%
POVERTY
80.4/ 100
METRIC RATING
142nd/ 347
METRIC RANK
13.1%
POVERTY
6.1/ 100
METRIC RATING
210th/ 347
METRIC RANK
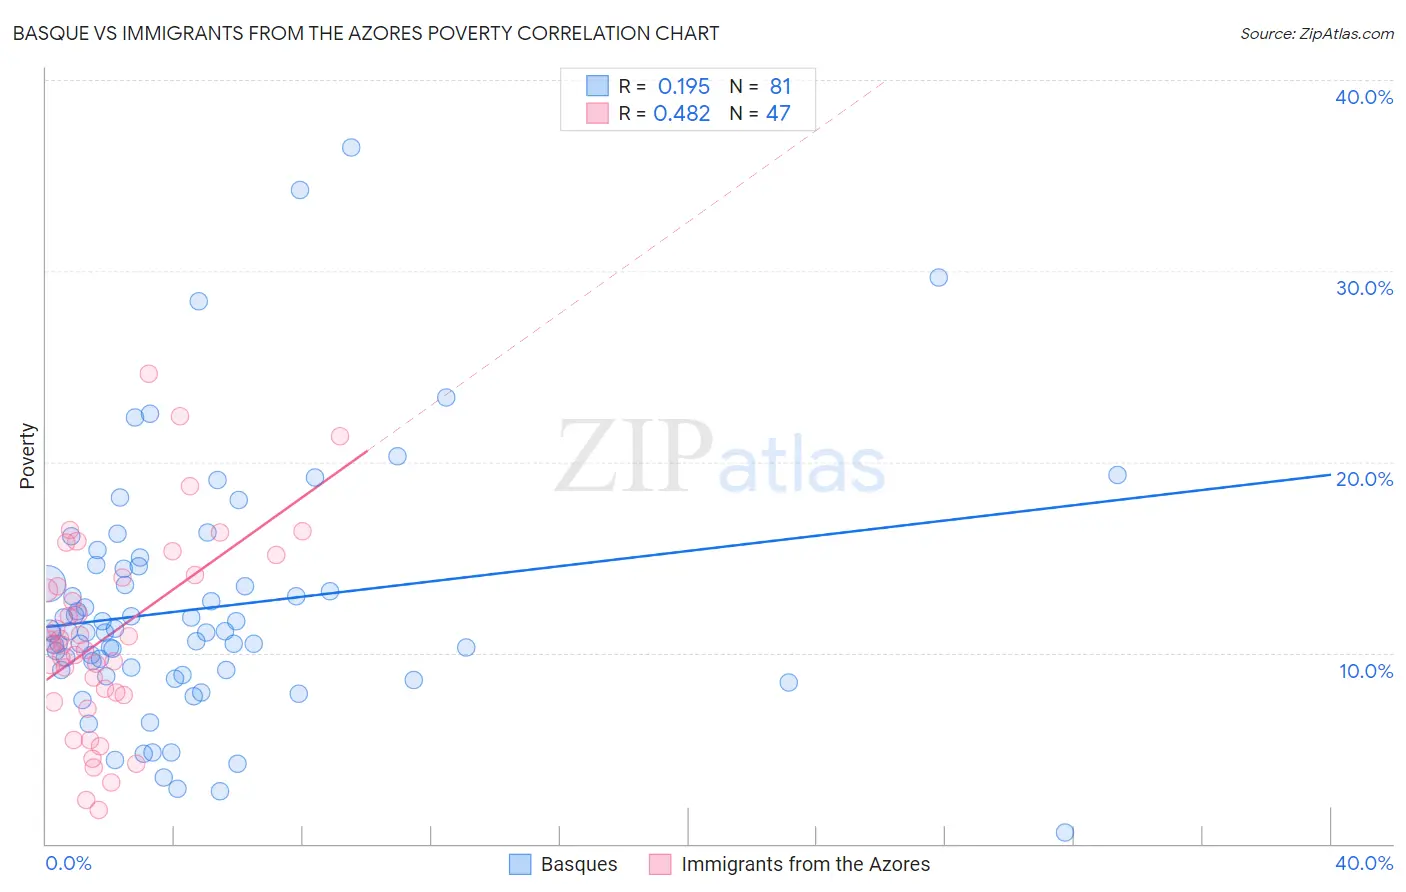
Basque vs Immigrants from the Azores Poverty Correlation Chart
The statistical analysis conducted on geographies consisting of 165,732,403 people shows a poor positive correlation between the proportion of Basques and poverty level in the United States with a correlation coefficient (R) of 0.195 and weighted average of 11.9%. Similarly, the statistical analysis conducted on geographies consisting of 46,256,915 people shows a moderate positive correlation between the proportion of Immigrants from the Azores and poverty level in the United States with a correlation coefficient (R) of 0.482 and weighted average of 13.1%, a difference of 10.4%.
Poverty Correlation Summary
| Measurement | Basque | Immigrants from the Azores |
| Minimum | 0.59% | 1.8% |
| Maximum | 36.5% | 24.6% |
| Range | 35.9% | 22.8% |
| Mean | 12.3% | 11.0% |
| Median | 11.1% | 10.5% |
| Interquartile 25% (IQ1) | 9.0% | 7.8% |
| Interquartile 75% (IQ3) | 14.5% | 14.1% |
| Interquartile Range (IQR) | 5.5% | 6.3% |
| Standard Deviation (Sample) | 6.4% | 5.1% |
| Standard Deviation (Population) | 6.4% | 5.1% |
Similar Demographics by Poverty
Demographics Similar to Basques by Poverty
In terms of poverty, the demographic groups most similar to Basques are Immigrants from France (11.9%, a difference of 0.020%), Immigrants from Peru (11.9%, a difference of 0.11%), Brazilian (11.9%, a difference of 0.11%), Pakistani (11.9%, a difference of 0.30%), and Immigrants from Jordan (11.9%, a difference of 0.32%).
| Demographics | Rating | Rank | Poverty |
| Immigrants | Vietnam | 85.2 /100 | #135 | Excellent 11.8% |
| Chileans | 84.2 /100 | #136 | Excellent 11.8% |
| Immigrants | Switzerland | 83.0 /100 | #137 | Excellent 11.8% |
| Immigrants | Jordan | 82.4 /100 | #138 | Excellent 11.9% |
| Pakistanis | 82.2 /100 | #139 | Excellent 11.9% |
| Immigrants | Peru | 81.1 /100 | #140 | Excellent 11.9% |
| Immigrants | France | 80.5 /100 | #141 | Excellent 11.9% |
| Basques | 80.4 /100 | #142 | Excellent 11.9% |
| Brazilians | 79.7 /100 | #143 | Good 11.9% |
| Icelanders | 77.9 /100 | #144 | Good 11.9% |
| Syrians | 75.1 /100 | #145 | Good 12.0% |
| Afghans | 74.9 /100 | #146 | Good 12.0% |
| Immigrants | Bosnia and Herzegovina | 73.7 /100 | #147 | Good 12.0% |
| Immigrants | Germany | 72.7 /100 | #148 | Good 12.0% |
| Immigrants | Malaysia | 72.7 /100 | #149 | Good 12.0% |
Demographics Similar to Immigrants from the Azores by Poverty
In terms of poverty, the demographic groups most similar to Immigrants from the Azores are Malaysian (13.1%, a difference of 0.030%), Ugandan (13.1%, a difference of 0.060%), Panamanian (13.1%, a difference of 0.21%), Immigrants from Eastern Africa (13.1%, a difference of 0.34%), and Moroccan (13.2%, a difference of 0.35%).
| Demographics | Rating | Rank | Poverty |
| Hmong | 15.0 /100 | #203 | Poor 12.8% |
| Immigrants | Western Asia | 14.1 /100 | #204 | Poor 12.9% |
| Tsimshian | 9.2 /100 | #205 | Tragic 13.0% |
| Immigrants | Eastern Africa | 7.0 /100 | #206 | Tragic 13.1% |
| Panamanians | 6.6 /100 | #207 | Tragic 13.1% |
| Ugandans | 6.2 /100 | #208 | Tragic 13.1% |
| Malaysians | 6.1 /100 | #209 | Tragic 13.1% |
| Immigrants | Azores | 6.1 /100 | #210 | Tragic 13.1% |
| Moroccans | 5.2 /100 | #211 | Tragic 13.2% |
| Immigrants | Immigrants | 4.3 /100 | #212 | Tragic 13.2% |
| Immigrants | Panama | 4.1 /100 | #213 | Tragic 13.3% |
| Bermudans | 3.7 /100 | #214 | Tragic 13.3% |
| Japanese | 3.3 /100 | #215 | Tragic 13.3% |
| Immigrants | Nonimmigrants | 3.3 /100 | #216 | Tragic 13.3% |
| Immigrants | Uzbekistan | 3.2 /100 | #217 | Tragic 13.3% |