Nepalese vs Immigrants from Norway Poverty
COMPARE
Nepalese
Immigrants from Norway
Poverty
Poverty Comparison
Nepalese
Immigrants from Norway
14.0%
POVERTY
0.3/ 100
METRIC RATING
244th/ 347
METRIC RANK
11.7%
POVERTY
88.0/ 100
METRIC RATING
126th/ 347
METRIC RANK
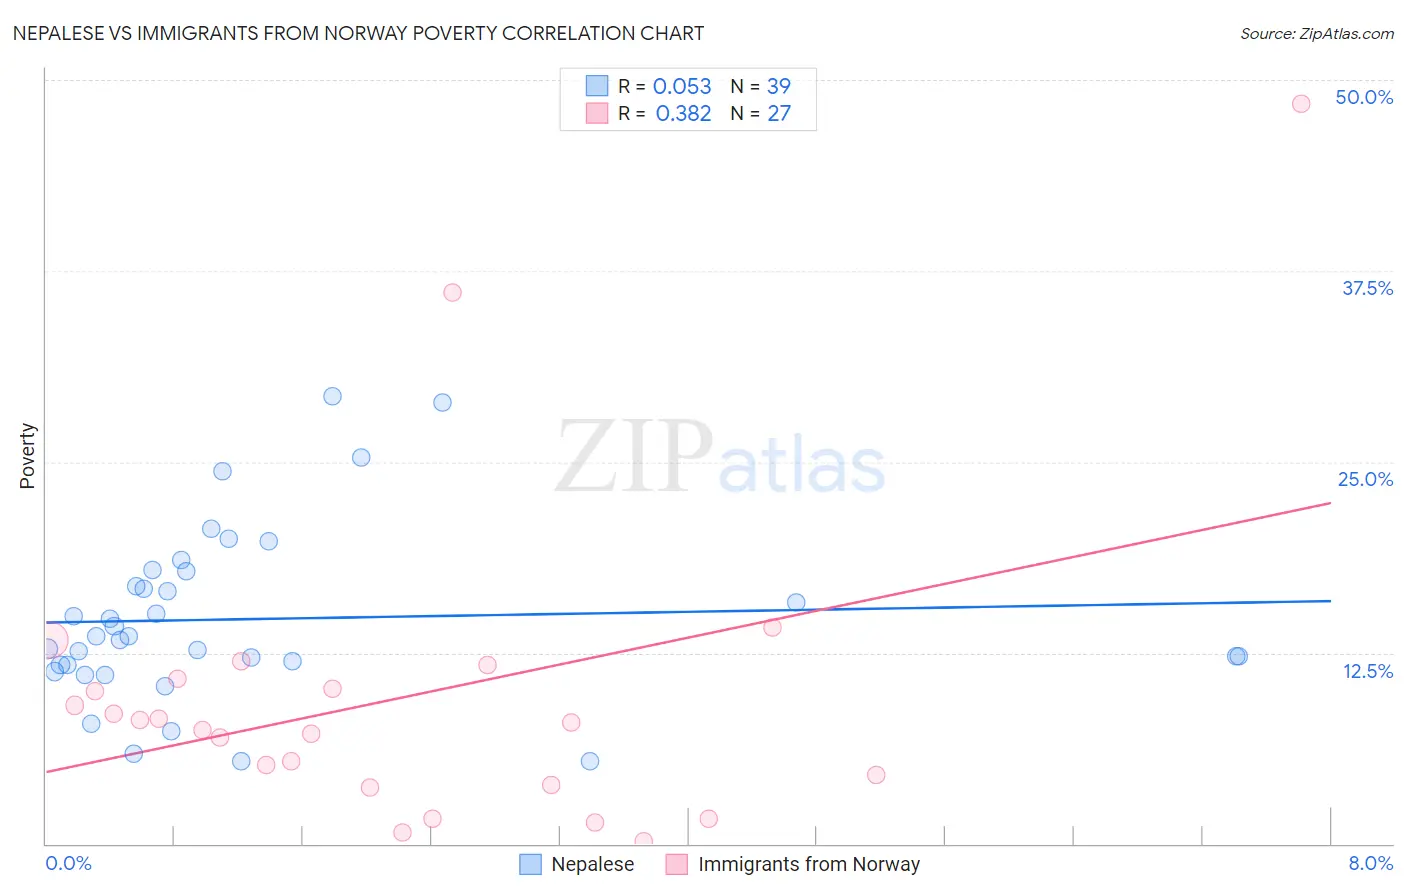
Nepalese vs Immigrants from Norway Poverty Correlation Chart
The statistical analysis conducted on geographies consisting of 24,519,269 people shows a slight positive correlation between the proportion of Nepalese and poverty level in the United States with a correlation coefficient (R) of 0.053 and weighted average of 14.0%. Similarly, the statistical analysis conducted on geographies consisting of 116,687,358 people shows a mild positive correlation between the proportion of Immigrants from Norway and poverty level in the United States with a correlation coefficient (R) of 0.382 and weighted average of 11.7%, a difference of 19.6%.
Poverty Correlation Summary
| Measurement | Nepalese | Immigrants from Norway |
| Minimum | 5.4% | 0.18% |
| Maximum | 29.3% | 48.4% |
| Range | 23.9% | 48.3% |
| Mean | 14.7% | 9.6% |
| Median | 13.6% | 7.9% |
| Interquartile 25% (IQ1) | 11.7% | 3.9% |
| Interquartile 75% (IQ3) | 17.8% | 10.8% |
| Interquartile Range (IQR) | 6.1% | 6.9% |
| Standard Deviation (Sample) | 5.7% | 10.3% |
| Standard Deviation (Population) | 5.6% | 10.1% |
Similar Demographics by Poverty
Demographics Similar to Nepalese by Poverty
In terms of poverty, the demographic groups most similar to Nepalese are Sudanese (14.0%, a difference of 0.030%), Ecuadorian (14.0%, a difference of 0.10%), Immigrants from Sudan (14.1%, a difference of 0.39%), Salvadoran (14.0%, a difference of 0.41%), and Immigrants from Middle Africa (14.0%, a difference of 0.44%).
| Demographics | Rating | Rank | Poverty |
| French American Indians | 0.5 /100 | #237 | Tragic 13.9% |
| Ghanaians | 0.5 /100 | #238 | Tragic 13.9% |
| Nicaraguans | 0.4 /100 | #239 | Tragic 13.9% |
| Immigrants | Middle Africa | 0.4 /100 | #240 | Tragic 14.0% |
| Salvadorans | 0.4 /100 | #241 | Tragic 14.0% |
| Ecuadorians | 0.4 /100 | #242 | Tragic 14.0% |
| Sudanese | 0.3 /100 | #243 | Tragic 14.0% |
| Nepalese | 0.3 /100 | #244 | Tragic 14.0% |
| Immigrants | Sudan | 0.3 /100 | #245 | Tragic 14.1% |
| Potawatomi | 0.3 /100 | #246 | Tragic 14.1% |
| Liberians | 0.2 /100 | #247 | Tragic 14.1% |
| Immigrants | Western Africa | 0.2 /100 | #248 | Tragic 14.1% |
| Immigrants | Ghana | 0.2 /100 | #249 | Tragic 14.2% |
| Cree | 0.2 /100 | #250 | Tragic 14.2% |
| Immigrants | Burma/Myanmar | 0.2 /100 | #251 | Tragic 14.2% |
Demographics Similar to Immigrants from Norway by Poverty
In terms of poverty, the demographic groups most similar to Immigrants from Norway are Immigrants from Argentina (11.7%, a difference of 0.020%), Immigrants from Brazil (11.7%, a difference of 0.040%), Soviet Union (11.7%, a difference of 0.080%), Immigrants from Israel (11.7%, a difference of 0.14%), and Immigrants from Hungary (11.7%, a difference of 0.15%).
| Demographics | Rating | Rank | Poverty |
| Tlingit-Haida | 89.0 /100 | #119 | Excellent 11.7% |
| Immigrants | South Eastern Asia | 88.9 /100 | #120 | Excellent 11.7% |
| New Zealanders | 88.7 /100 | #121 | Excellent 11.7% |
| Puget Sound Salish | 88.7 /100 | #122 | Excellent 11.7% |
| Immigrants | Hungary | 88.6 /100 | #123 | Excellent 11.7% |
| Soviet Union | 88.4 /100 | #124 | Excellent 11.7% |
| Immigrants | Brazil | 88.2 /100 | #125 | Excellent 11.7% |
| Immigrants | Norway | 88.0 /100 | #126 | Excellent 11.7% |
| Immigrants | Argentina | 88.0 /100 | #127 | Excellent 11.7% |
| Immigrants | Israel | 87.4 /100 | #128 | Excellent 11.7% |
| South Africans | 87.0 /100 | #129 | Excellent 11.7% |
| Immigrants | Ukraine | 86.6 /100 | #130 | Excellent 11.8% |
| French | 86.1 /100 | #131 | Excellent 11.8% |
| Peruvians | 85.6 /100 | #132 | Excellent 11.8% |
| Immigrants | Western Europe | 85.2 /100 | #133 | Excellent 11.8% |