Basque vs Immigrants from Laos Single Mother Poverty
COMPARE
Basque
Immigrants from Laos
Single Mother Poverty
Single Mother Poverty Comparison
Basques
Immigrants from Laos
29.5%
SINGLE MOTHER POVERTY
28.3/ 100
METRIC RATING
193rd/ 347
METRIC RANK
30.6%
SINGLE MOTHER POVERTY
1.8/ 100
METRIC RATING
241st/ 347
METRIC RANK
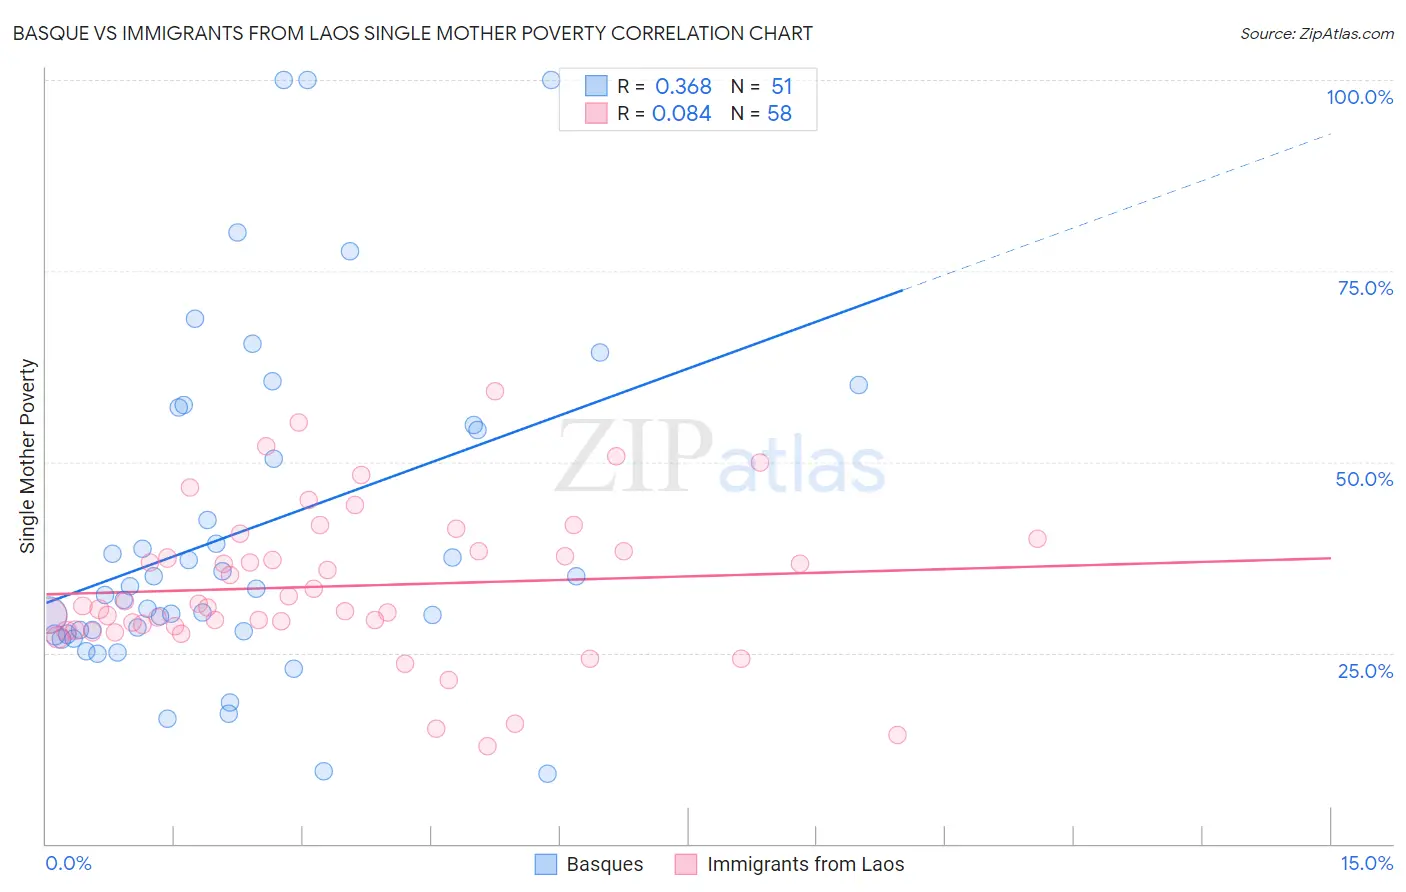
Basque vs Immigrants from Laos Single Mother Poverty Correlation Chart
The statistical analysis conducted on geographies consisting of 163,930,672 people shows a mild positive correlation between the proportion of Basques and poverty level among single mothers in the United States with a correlation coefficient (R) of 0.368 and weighted average of 29.5%. Similarly, the statistical analysis conducted on geographies consisting of 199,327,498 people shows a slight positive correlation between the proportion of Immigrants from Laos and poverty level among single mothers in the United States with a correlation coefficient (R) of 0.084 and weighted average of 30.6%, a difference of 3.7%.
Single Mother Poverty Correlation Summary
| Measurement | Basque | Immigrants from Laos |
| Minimum | 9.1% | 12.7% |
| Maximum | 100.0% | 59.2% |
| Range | 90.9% | 46.5% |
| Mean | 41.0% | 33.7% |
| Median | 33.3% | 31.3% |
| Interquartile 25% (IQ1) | 27.4% | 28.5% |
| Interquartile 75% (IQ3) | 54.8% | 38.3% |
| Interquartile Range (IQR) | 27.3% | 9.9% |
| Standard Deviation (Sample) | 22.0% | 9.8% |
| Standard Deviation (Population) | 21.8% | 9.7% |
Similar Demographics by Single Mother Poverty
Demographics Similar to Basques by Single Mother Poverty
In terms of single mother poverty, the demographic groups most similar to Basques are Moroccan (29.5%, a difference of 0.020%), Immigrants from Trinidad and Tobago (29.5%, a difference of 0.050%), Immigrants from Germany (29.5%, a difference of 0.12%), Icelander (29.5%, a difference of 0.13%), and Immigrants from Africa (29.4%, a difference of 0.19%).
| Demographics | Rating | Rank | Single Mother Poverty |
| Yugoslavians | 36.0 /100 | #186 | Fair 29.4% |
| Lebanese | 32.5 /100 | #187 | Fair 29.4% |
| Guamanians/Chamorros | 31.8 /100 | #188 | Fair 29.4% |
| Immigrants | Africa | 31.6 /100 | #189 | Fair 29.4% |
| Immigrants | Germany | 30.4 /100 | #190 | Fair 29.5% |
| Immigrants | Trinidad and Tobago | 29.2 /100 | #191 | Fair 29.5% |
| Moroccans | 28.6 /100 | #192 | Fair 29.5% |
| Basques | 28.3 /100 | #193 | Fair 29.5% |
| Icelanders | 26.1 /100 | #194 | Fair 29.5% |
| Slavs | 24.5 /100 | #195 | Fair 29.6% |
| Spanish American Indians | 23.4 /100 | #196 | Fair 29.6% |
| Immigrants | Jamaica | 22.0 /100 | #197 | Fair 29.6% |
| Trinidadians and Tobagonians | 21.7 /100 | #198 | Fair 29.6% |
| Cubans | 20.8 /100 | #199 | Fair 29.6% |
| Panamanians | 20.0 /100 | #200 | Fair 29.6% |
Demographics Similar to Immigrants from Laos by Single Mother Poverty
In terms of single mother poverty, the demographic groups most similar to Immigrants from Laos are Immigrants from Burma/Myanmar (30.6%, a difference of 0.020%), Salvadoran (30.6%, a difference of 0.050%), Bermudan (30.6%, a difference of 0.10%), Immigrants from Portugal (30.5%, a difference of 0.18%), and French (30.7%, a difference of 0.32%).
| Demographics | Rating | Rank | Single Mother Poverty |
| Immigrants | Nicaragua | 3.5 /100 | #234 | Tragic 30.3% |
| Immigrants | Grenada | 3.4 /100 | #235 | Tragic 30.3% |
| Welsh | 3.2 /100 | #236 | Tragic 30.4% |
| Immigrants | St. Vincent and the Grenadines | 3.1 /100 | #237 | Tragic 30.4% |
| Slovaks | 2.8 /100 | #238 | Tragic 30.4% |
| Immigrants | Portugal | 2.1 /100 | #239 | Tragic 30.5% |
| Salvadorans | 1.8 /100 | #240 | Tragic 30.6% |
| Immigrants | Laos | 1.8 /100 | #241 | Tragic 30.6% |
| Immigrants | Burma/Myanmar | 1.7 /100 | #242 | Tragic 30.6% |
| Bermudans | 1.6 /100 | #243 | Tragic 30.6% |
| French | 1.3 /100 | #244 | Tragic 30.7% |
| Barbadians | 1.3 /100 | #245 | Tragic 30.7% |
| Ecuadorians | 0.9 /100 | #246 | Tragic 30.8% |
| West Indians | 0.9 /100 | #247 | Tragic 30.8% |
| French Canadians | 0.9 /100 | #248 | Tragic 30.8% |