Basque vs Peruvian Single Mother Poverty
COMPARE
Basque
Peruvian
Single Mother Poverty
Single Mother Poverty Comparison
Basques
Peruvians
29.5%
SINGLE MOTHER POVERTY
28.3/ 100
METRIC RATING
193rd/ 347
METRIC RANK
27.5%
SINGLE MOTHER POVERTY
99.2/ 100
METRIC RATING
76th/ 347
METRIC RANK
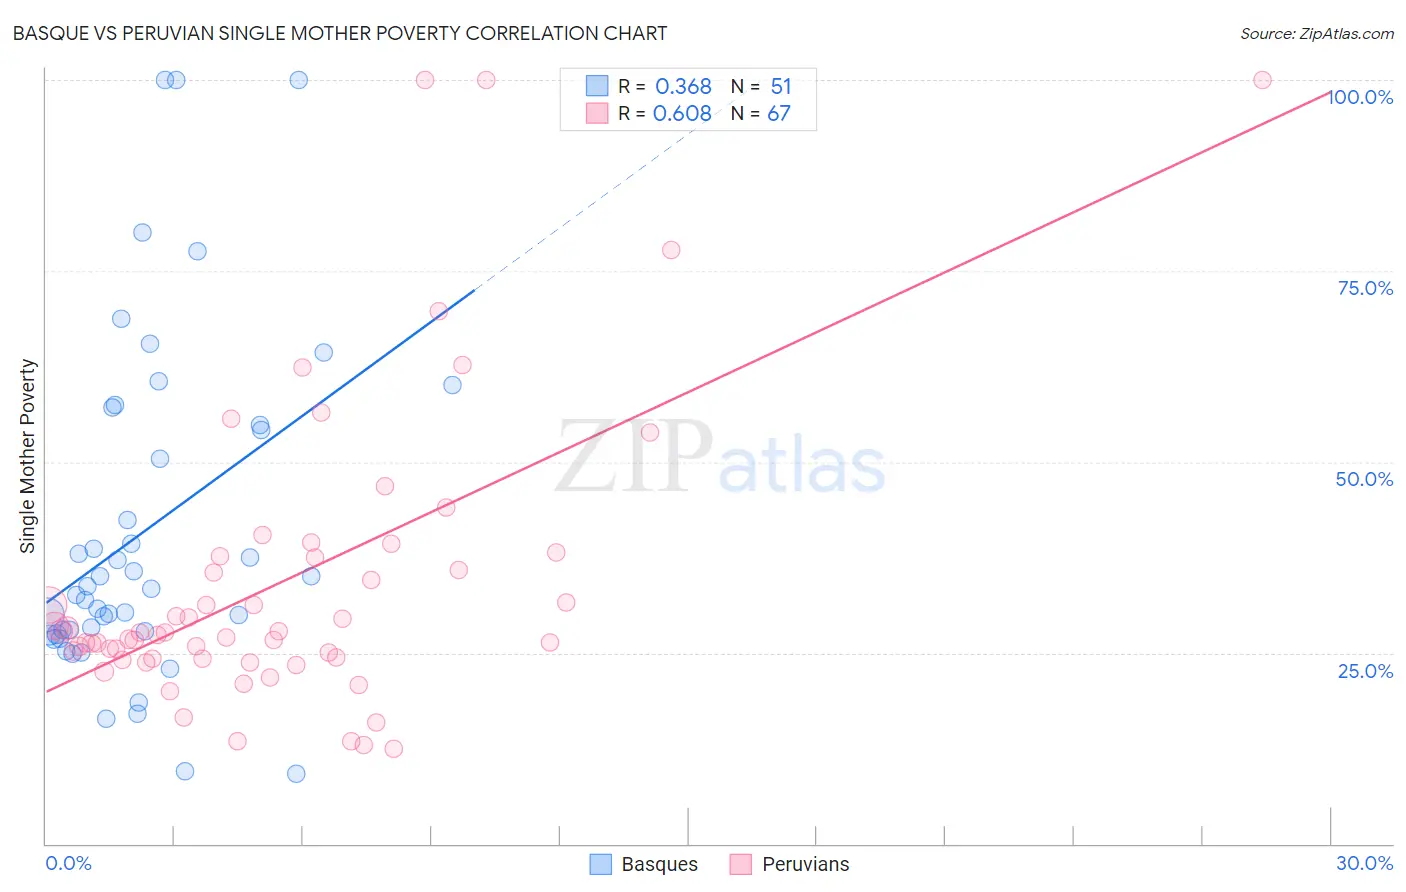
Basque vs Peruvian Single Mother Poverty Correlation Chart
The statistical analysis conducted on geographies consisting of 163,930,672 people shows a mild positive correlation between the proportion of Basques and poverty level among single mothers in the United States with a correlation coefficient (R) of 0.368 and weighted average of 29.5%. Similarly, the statistical analysis conducted on geographies consisting of 355,516,377 people shows a significant positive correlation between the proportion of Peruvians and poverty level among single mothers in the United States with a correlation coefficient (R) of 0.608 and weighted average of 27.5%, a difference of 7.3%.
Single Mother Poverty Correlation Summary
| Measurement | Basque | Peruvian |
| Minimum | 9.1% | 12.4% |
| Maximum | 100.0% | 100.0% |
| Range | 90.9% | 87.6% |
| Mean | 41.0% | 34.3% |
| Median | 33.3% | 27.6% |
| Interquartile 25% (IQ1) | 27.4% | 24.2% |
| Interquartile 75% (IQ3) | 54.8% | 37.7% |
| Interquartile Range (IQR) | 27.3% | 13.4% |
| Standard Deviation (Sample) | 22.0% | 19.4% |
| Standard Deviation (Population) | 21.8% | 19.2% |
Similar Demographics by Single Mother Poverty
Demographics Similar to Basques by Single Mother Poverty
In terms of single mother poverty, the demographic groups most similar to Basques are Moroccan (29.5%, a difference of 0.020%), Immigrants from Trinidad and Tobago (29.5%, a difference of 0.050%), Immigrants from Germany (29.5%, a difference of 0.12%), Icelander (29.5%, a difference of 0.13%), and Immigrants from Africa (29.4%, a difference of 0.19%).
| Demographics | Rating | Rank | Single Mother Poverty |
| Yugoslavians | 36.0 /100 | #186 | Fair 29.4% |
| Lebanese | 32.5 /100 | #187 | Fair 29.4% |
| Guamanians/Chamorros | 31.8 /100 | #188 | Fair 29.4% |
| Immigrants | Africa | 31.6 /100 | #189 | Fair 29.4% |
| Immigrants | Germany | 30.4 /100 | #190 | Fair 29.5% |
| Immigrants | Trinidad and Tobago | 29.2 /100 | #191 | Fair 29.5% |
| Moroccans | 28.6 /100 | #192 | Fair 29.5% |
| Basques | 28.3 /100 | #193 | Fair 29.5% |
| Icelanders | 26.1 /100 | #194 | Fair 29.5% |
| Slavs | 24.5 /100 | #195 | Fair 29.6% |
| Spanish American Indians | 23.4 /100 | #196 | Fair 29.6% |
| Immigrants | Jamaica | 22.0 /100 | #197 | Fair 29.6% |
| Trinidadians and Tobagonians | 21.7 /100 | #198 | Fair 29.6% |
| Cubans | 20.8 /100 | #199 | Fair 29.6% |
| Panamanians | 20.0 /100 | #200 | Fair 29.6% |
Demographics Similar to Peruvians by Single Mother Poverty
In terms of single mother poverty, the demographic groups most similar to Peruvians are Immigrants from Peru (27.5%, a difference of 0.020%), Immigrants from North Macedonia (27.5%, a difference of 0.030%), Immigrants from Sweden (27.5%, a difference of 0.040%), Immigrants from Italy (27.5%, a difference of 0.070%), and Taiwanese (27.5%, a difference of 0.070%).
| Demographics | Rating | Rank | Single Mother Poverty |
| Lithuanians | 99.4 /100 | #69 | Exceptional 27.4% |
| Immigrants | Belarus | 99.4 /100 | #70 | Exceptional 27.4% |
| Macedonians | 99.4 /100 | #71 | Exceptional 27.4% |
| Immigrants | Russia | 99.4 /100 | #72 | Exceptional 27.4% |
| Sierra Leoneans | 99.3 /100 | #73 | Exceptional 27.4% |
| Immigrants | Europe | 99.3 /100 | #74 | Exceptional 27.4% |
| Immigrants | Sweden | 99.2 /100 | #75 | Exceptional 27.5% |
| Peruvians | 99.2 /100 | #76 | Exceptional 27.5% |
| Immigrants | Peru | 99.2 /100 | #77 | Exceptional 27.5% |
| Immigrants | North Macedonia | 99.2 /100 | #78 | Exceptional 27.5% |
| Immigrants | Italy | 99.1 /100 | #79 | Exceptional 27.5% |
| Taiwanese | 99.1 /100 | #80 | Exceptional 27.5% |
| Immigrants | Scotland | 98.9 /100 | #81 | Exceptional 27.6% |
| Immigrants | Cameroon | 98.8 /100 | #82 | Exceptional 27.6% |
| Greeks | 98.7 /100 | #83 | Exceptional 27.7% |