Potawatomi vs Immigrants from Laos Single Mother Poverty
COMPARE
Potawatomi
Immigrants from Laos
Single Mother Poverty
Single Mother Poverty Comparison
Potawatomi
Immigrants from Laos
34.1%
SINGLE MOTHER POVERTY
0.0/ 100
METRIC RATING
309th/ 347
METRIC RANK
30.6%
SINGLE MOTHER POVERTY
1.8/ 100
METRIC RATING
241st/ 347
METRIC RANK
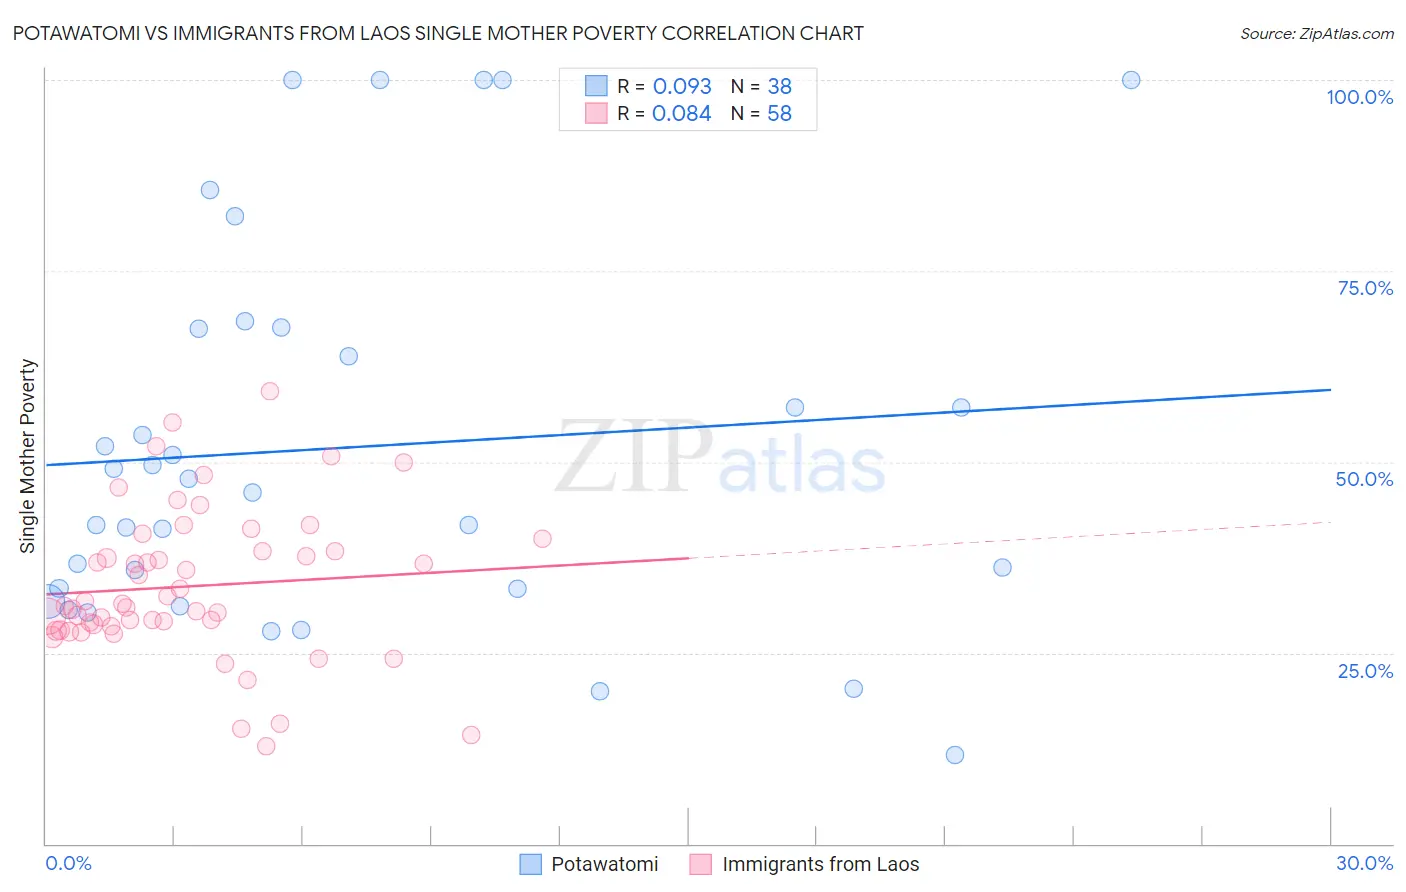
Potawatomi vs Immigrants from Laos Single Mother Poverty Correlation Chart
The statistical analysis conducted on geographies consisting of 116,799,639 people shows a slight positive correlation between the proportion of Potawatomi and poverty level among single mothers in the United States with a correlation coefficient (R) of 0.093 and weighted average of 34.1%. Similarly, the statistical analysis conducted on geographies consisting of 199,327,498 people shows a slight positive correlation between the proportion of Immigrants from Laos and poverty level among single mothers in the United States with a correlation coefficient (R) of 0.084 and weighted average of 30.6%, a difference of 11.6%.
Single Mother Poverty Correlation Summary
| Measurement | Potawatomi | Immigrants from Laos |
| Minimum | 11.6% | 12.7% |
| Maximum | 100.0% | 59.2% |
| Range | 88.4% | 46.5% |
| Mean | 51.9% | 33.7% |
| Median | 46.9% | 31.3% |
| Interquartile 25% (IQ1) | 33.3% | 28.5% |
| Interquartile 75% (IQ3) | 67.5% | 38.3% |
| Interquartile Range (IQR) | 34.2% | 9.9% |
| Standard Deviation (Sample) | 25.0% | 9.8% |
| Standard Deviation (Population) | 24.6% | 9.7% |
Similar Demographics by Single Mother Poverty
Demographics Similar to Potawatomi by Single Mother Poverty
In terms of single mother poverty, the demographic groups most similar to Potawatomi are Honduran (34.2%, a difference of 0.22%), Immigrants from Mexico (34.0%, a difference of 0.42%), Alsatian (34.3%, a difference of 0.53%), Comanche (33.9%, a difference of 0.60%), and Central American Indian (34.3%, a difference of 0.61%).
| Demographics | Rating | Rank | Single Mother Poverty |
| Arapaho | 0.0 /100 | #302 | Tragic 33.4% |
| Americans | 0.0 /100 | #303 | Tragic 33.5% |
| Mexicans | 0.0 /100 | #304 | Tragic 33.6% |
| Immigrants | Central America | 0.0 /100 | #305 | Tragic 33.6% |
| Immigrants | Congo | 0.0 /100 | #306 | Tragic 33.8% |
| Comanche | 0.0 /100 | #307 | Tragic 33.9% |
| Immigrants | Mexico | 0.0 /100 | #308 | Tragic 34.0% |
| Potawatomi | 0.0 /100 | #309 | Tragic 34.1% |
| Hondurans | 0.0 /100 | #310 | Tragic 34.2% |
| Alsatians | 0.0 /100 | #311 | Tragic 34.3% |
| Central American Indians | 0.0 /100 | #312 | Tragic 34.3% |
| Immigrants | Dominican Republic | 0.0 /100 | #313 | Tragic 34.4% |
| Chickasaw | 0.0 /100 | #314 | Tragic 34.4% |
| Hopi | 0.0 /100 | #315 | Tragic 34.5% |
| Dominicans | 0.0 /100 | #316 | Tragic 34.5% |
Demographics Similar to Immigrants from Laos by Single Mother Poverty
In terms of single mother poverty, the demographic groups most similar to Immigrants from Laos are Immigrants from Burma/Myanmar (30.6%, a difference of 0.020%), Salvadoran (30.6%, a difference of 0.050%), Bermudan (30.6%, a difference of 0.10%), Immigrants from Portugal (30.5%, a difference of 0.18%), and French (30.7%, a difference of 0.32%).
| Demographics | Rating | Rank | Single Mother Poverty |
| Immigrants | Nicaragua | 3.5 /100 | #234 | Tragic 30.3% |
| Immigrants | Grenada | 3.4 /100 | #235 | Tragic 30.3% |
| Welsh | 3.2 /100 | #236 | Tragic 30.4% |
| Immigrants | St. Vincent and the Grenadines | 3.1 /100 | #237 | Tragic 30.4% |
| Slovaks | 2.8 /100 | #238 | Tragic 30.4% |
| Immigrants | Portugal | 2.1 /100 | #239 | Tragic 30.5% |
| Salvadorans | 1.8 /100 | #240 | Tragic 30.6% |
| Immigrants | Laos | 1.8 /100 | #241 | Tragic 30.6% |
| Immigrants | Burma/Myanmar | 1.7 /100 | #242 | Tragic 30.6% |
| Bermudans | 1.6 /100 | #243 | Tragic 30.6% |
| French | 1.3 /100 | #244 | Tragic 30.7% |
| Barbadians | 1.3 /100 | #245 | Tragic 30.7% |
| Ecuadorians | 0.9 /100 | #246 | Tragic 30.8% |
| West Indians | 0.9 /100 | #247 | Tragic 30.8% |
| French Canadians | 0.9 /100 | #248 | Tragic 30.8% |